


by Matthew Barsalou, guest blogger
Control charts plot your process data to identify and distinguish between common cause and special cause variation. This is important, because identifying the different causes of variation lets you take action to make improvements in your process without over-controlling it.
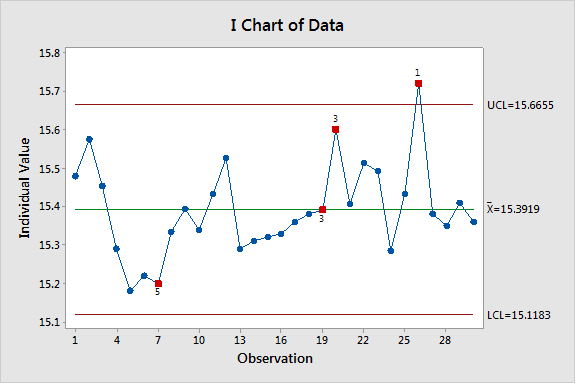
When you create a control chart, the software you're using should make it easy to see where you may have variation that requires your attention. For example, Minitab Statistical Software automatically flags any control chart data point that is more than three standard deviations above the centerline, as shown in the I chart below.
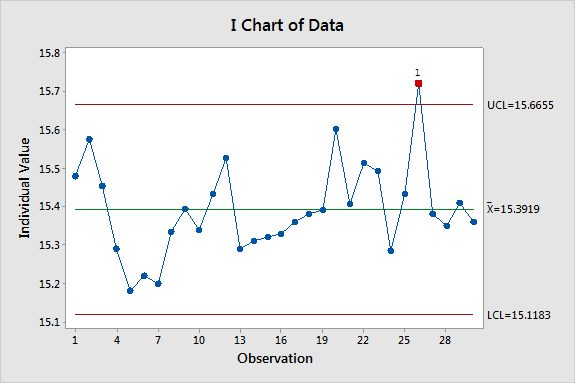
I chart example with one out-of-control point.
A data point that more than three standard deviations from the centerline is one indicator for detecting special-cause variation in a process. There are additional control chart rules introduced by Dr. Lloyd S. Nelson in his April 1984 Journal of Quality Technology column. The eight Nelson Rules are shown below, and if you're interested in using them, they can be activated in Minitab.
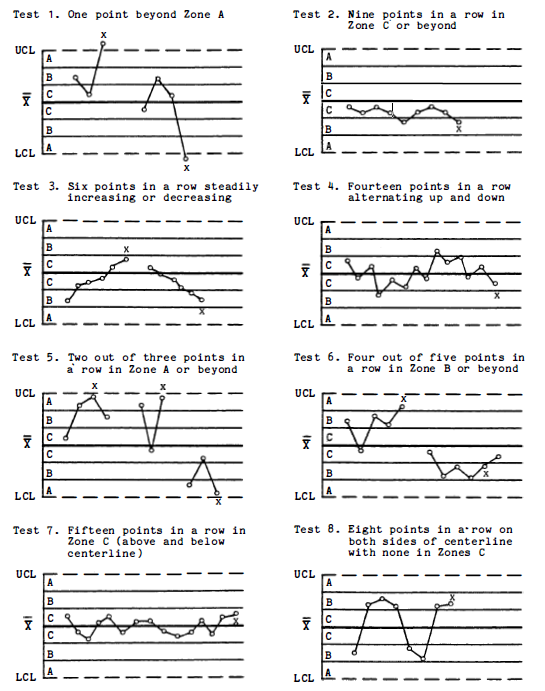
The Nelson rules for tests of special causes. Reprinted with permission from Journal of Quality Technology © 1984 ASQ, asq.org.
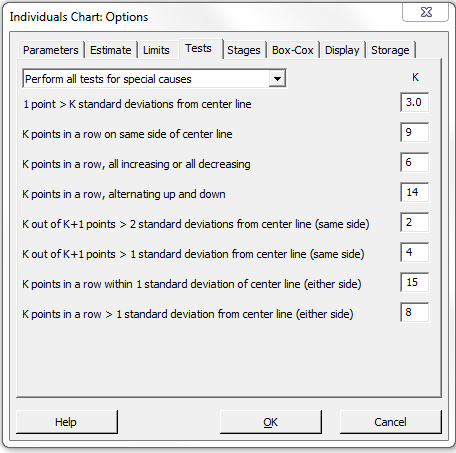
To activate the Nelson rules, go to Control Charts > Variables Charts for Individuals > Individuals... and then click on "I Chart Options." Go to the Tests tab and place a check mark next to the test you would like to select—or simply use the drop-down menu and select “Perform all tests for special causes,” as shown below.
The resulting session window explains which tests failed.
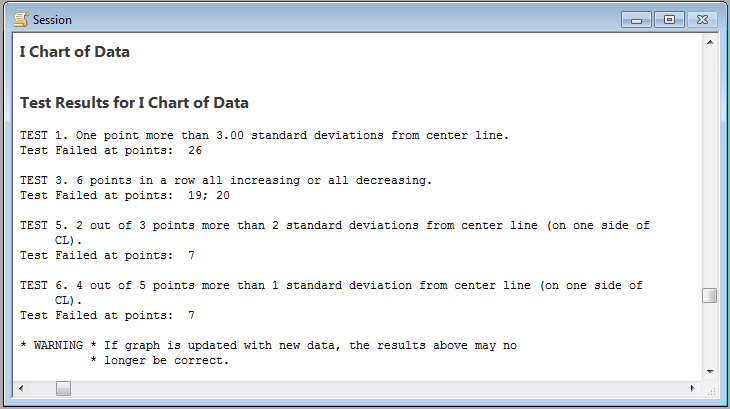
On the chart itself, the data points that failed each test are identified in red as shown below.
Simply activating all of the rules is not recommended—the false positive rate goes up as each additional rule is activated. At some point the control chart will become more sensitive than it needs to be and corrective actions for special causes of variation may be implemented when only common cause is variation present.
Fortunately, Nelson provided detailed guidance on the correct application of his namesake rules. Nelson’s guidance on applying his rules for tests of special causes is presented below.
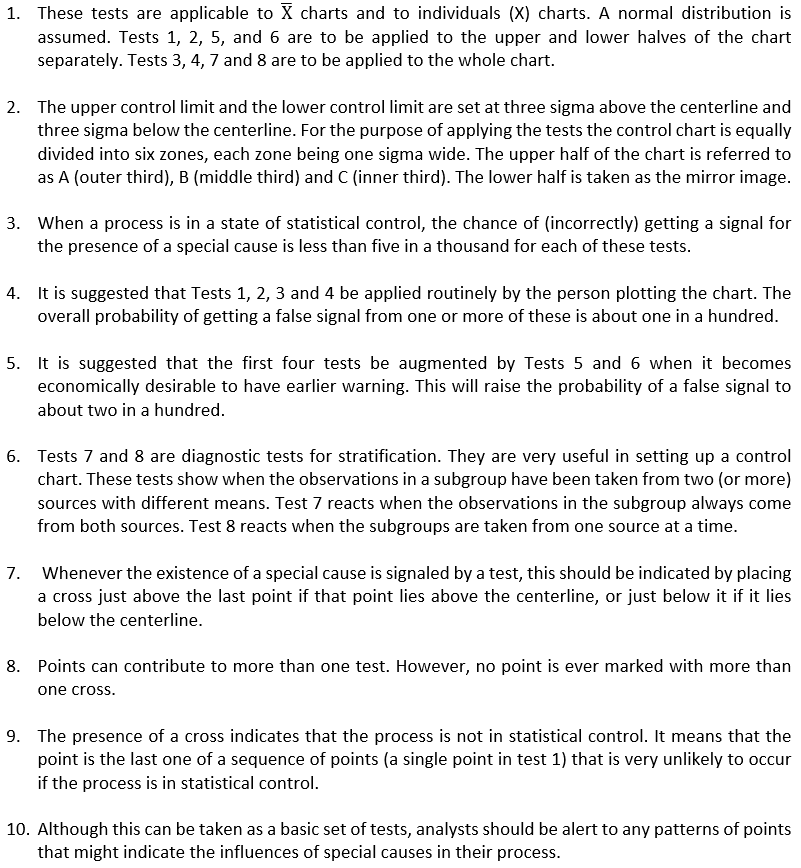
Comments on tests for special causes. Reprinted with permission from Journal of Quality Technology ©1984 ASQ, asq.org.
Nelson’s tenth comment is an especially important one, regardless of which tests have been activated.
Minitab, together with the Nelson rules, can be very helpful, but neither can replace or remove the need for the analyst's judgment when assessing a control chart. These rules can, however, assist the analyst in making the proper decision.
About the Guest Blogger
Matthew Barsalou is a statistical problem resolution Master Black Belt at BorgWarner Turbo Systems Engineering GmbH. He is a Smarter Solutions certified Lean Six Sigma Master Black Belt, ASQ-certified Six Sigma Black Belt, quality engineer, and quality technician, and a TÜV-certified quality manager, quality management representative, and auditor. He has a bachelor of science in industrial sciences, a master of liberal studies with emphasis in international business, and has a master of science in business administration and engineering from the Wilhelm Büchner Hochschule in Darmstadt, Germany. He is author of the books Root Cause Analysis: A Step-By-Step Guide to Using the Right Tool at the Right Time, Statistics for Six Sigma Black Belts and The ASQ Pocket Guide to Statistics for Six Sigma Black Belts.