


Now that the 2012 Olympics has concluded, the sight of all those muscled athletes has me thinking about my own physical fitness. I’m pretty active for a 30-something. I try to hit the gym or pool daily and I’ve been working through the BeachBody, P90X and Insanity workout programs for the past three years. I feel pretty fit and healthy. That is why it was such a shock when I went to the doctor for my yearly physical and they gave me a report stating I was overweight. I thought, this cannot be!
As it turns out, my doctor’s office used the standard BMI calculation to diagnose me as overweight. The BMI calculation uses an individual’s height and weight to determine body fat percentage. According to the National Heart Lung and Blood Institute Web site, the BMI calculation underestimates body fat in older persons who have lost muscle and overestimates body fat in those of us with a muscular build. The error rate for BMI can be as high as 20% for people with high muscle density.
Classifying Error: Sensitivity and Specificity
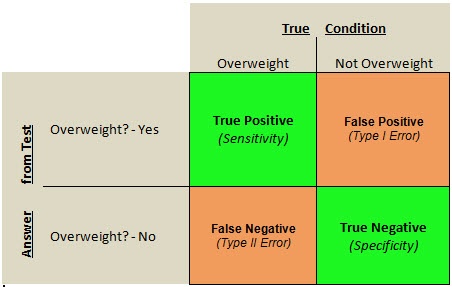 This started me thinking about two common statistical terms: sensitivity and specificity. Sensitivity measures the proportion of how many positives were positively identified. Specificity is the flip side--the number of negatives that are correctly identified as negatives. You might remember learning the 2x2 contingency table in your first statistics class and the example of guilty vs. not guilty and putting innocent people in jail. Sensitivity and specificity relate directly to that contingency table. A common tool used to identify sensitivity and specificity is ROC Curve graphs.
Additionally, the concepts of Type I and Type II error can also be derived from the contingency table. A Type I error would be to identify a negative positively (also called a false positive). A Type II error would be the exact opposite: saying that a truly positive result is negative.
When we apply alpha and beta risk thresholds to our data, we are trying to account for the possibility of making the Type I and Type II errors, respectively.
Ultra Lean
Since the error rate for BMI was so high for people with high muscle density, I investigated some other body fat measurement options. I decided to try the air-displacement plethysmography unit called the BodPod which had only approximately +/- 4% error rate. I worked with my dietician to schedule a BodPod appointment. As it turns out, I was at the extreme opposite end of “overweight.” Being a woman with just 17% body fat, I was classified as “Ultra Lean.” Thankfully, mine was a false positive diagnosis of overweight (Type I Error).
I guess all the blood, sweat, and tears with Tony Horton really are paying off!