


Six Sigma is a quality improvement method that businesses have used for decades—because it gets results. A Six Sigma project follows a clearly defined series of steps, and companies in every industry in every country around the world have used this method to resolve problems. Along the way, they've saved billions of dollars.
But Six Sigma relies heavily on statistics and data analysis, and many people new to quality improvement feel intimidated by the statistical aspects.
You needn't be intimidated. While it's true that data analysis is critical in improving quality, the majority of analyses in Six Sigma are not hard to understand, even if you’re not very knowledgeable about statistics.
Familiarizing yourself with these tools is a great place to start. This post briefly explains 5 statistical tools used in Six Sigma, what they do, and why they’re important.
1. Pareto Chart
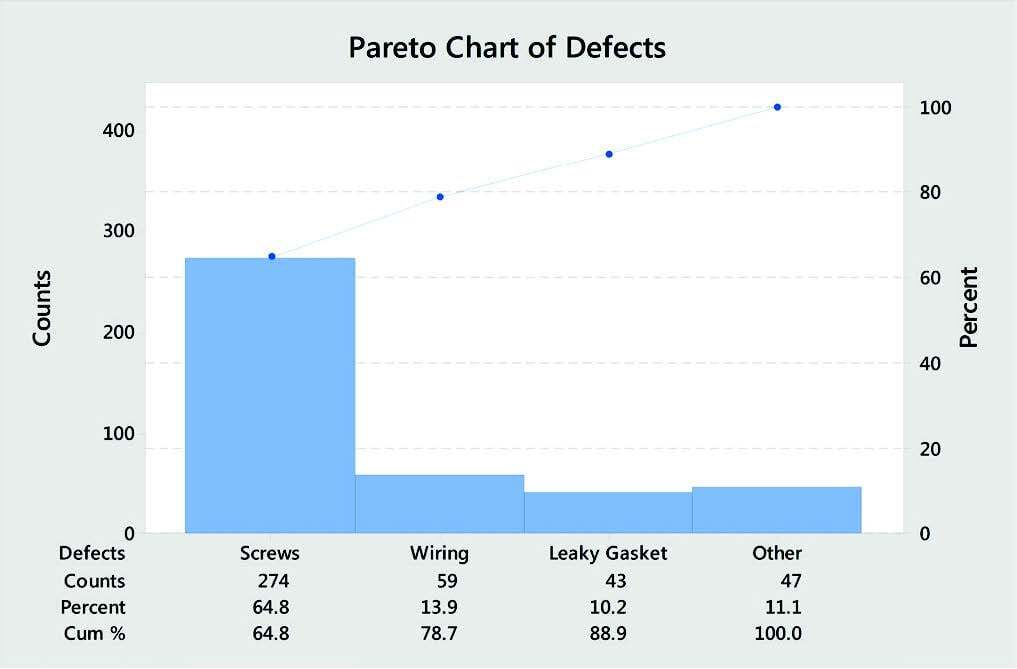
The Pareto Chart stems from an idea called the Pareto Principle, which asserts that about 80% of outcomes result from 20% of the causes. It's easy to think of examples even in our personal lives. For instance, you may wear 20% of your clothes 80% of the time, or listen to 20% of the music in your library 80% of the time.
The Pareto chart helps you visualize how this principle applies to data you've collected. It is a specialized type of bar chart designed to distinguish the “critical few” causes from the “trivial many” enabling you to focus on the most important issues. For example, if you collect data about defect types each time one occurs, a Pareto chart reveals which types are most frequent, so you can focus energy on solving the most pressing problems.
2. Histogram
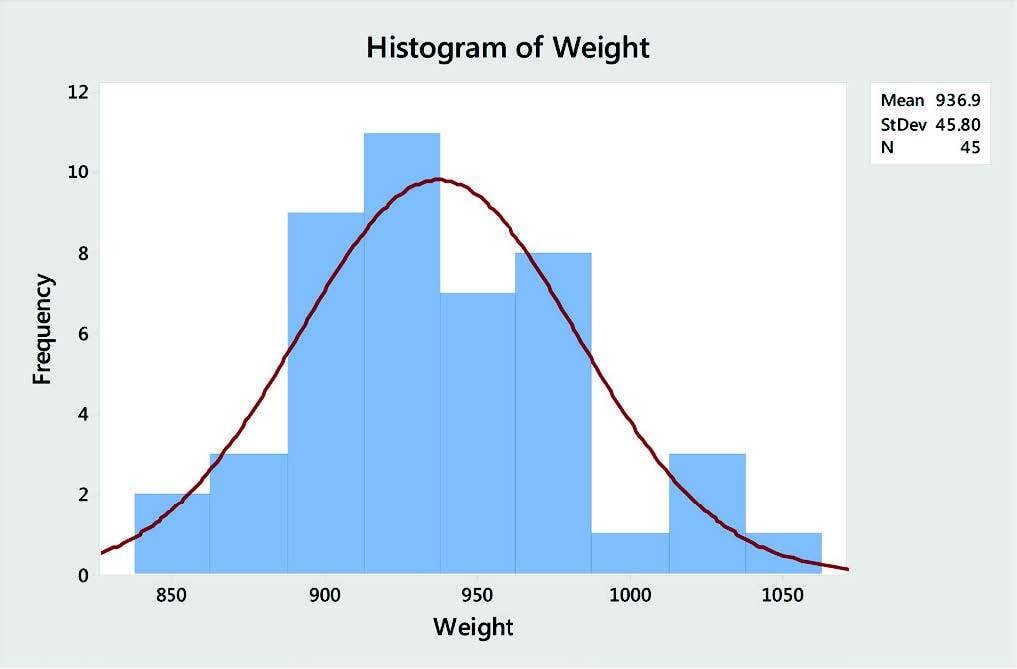
A histogram is a graphical snapshot of numeric, continuous data. Histograms enable you to quickly identify the center and spread of your data. It shows you where most of the data fall, as well as the minimum and maximum values. A histogram also reveals if your data are bell-shaped or not, and can help you find unusual data points and outliers that may need further investigation.
3. Gage R&R
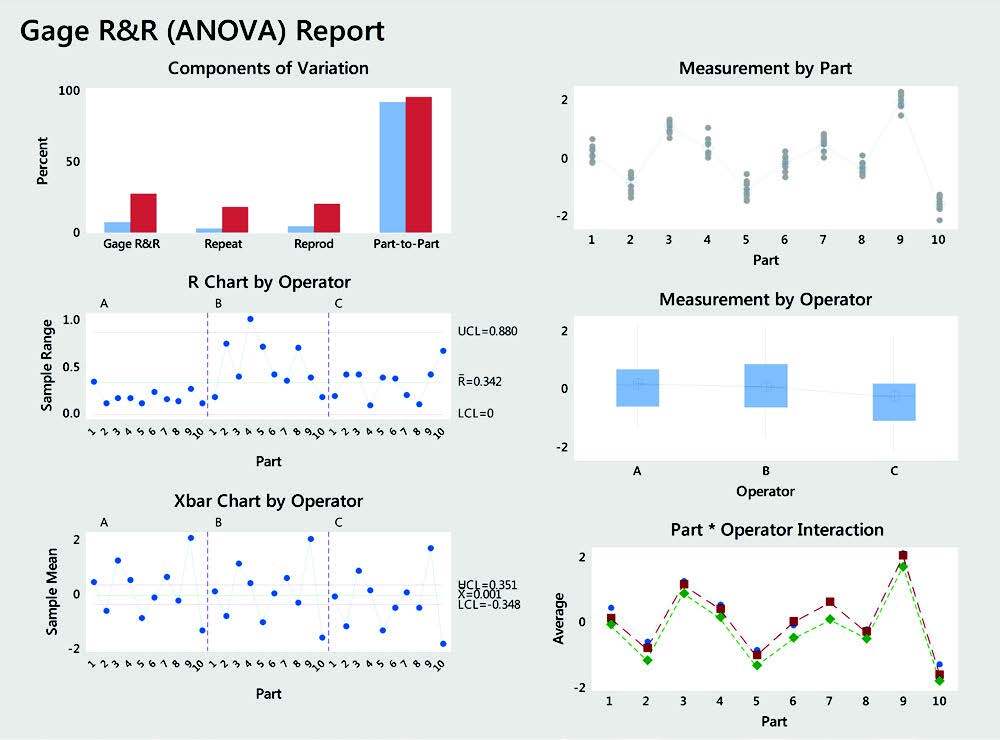
Accurate measurements are critical. Would you want to weigh yourself with a scale you know is unreliable? Would you keep using a thermometer that never shows the right temperature? If you can't measure a process accurately, you can't improve it, which is where Gage R&R comes in. This tool helps you determine if your continuous numeric measurements—such as weight, diameter, and pressure—are both repeatable and reproducible, both when the same person repeatedly measures the same part, and when different operators measure the same part.
4. Attribute Agreement Analysis
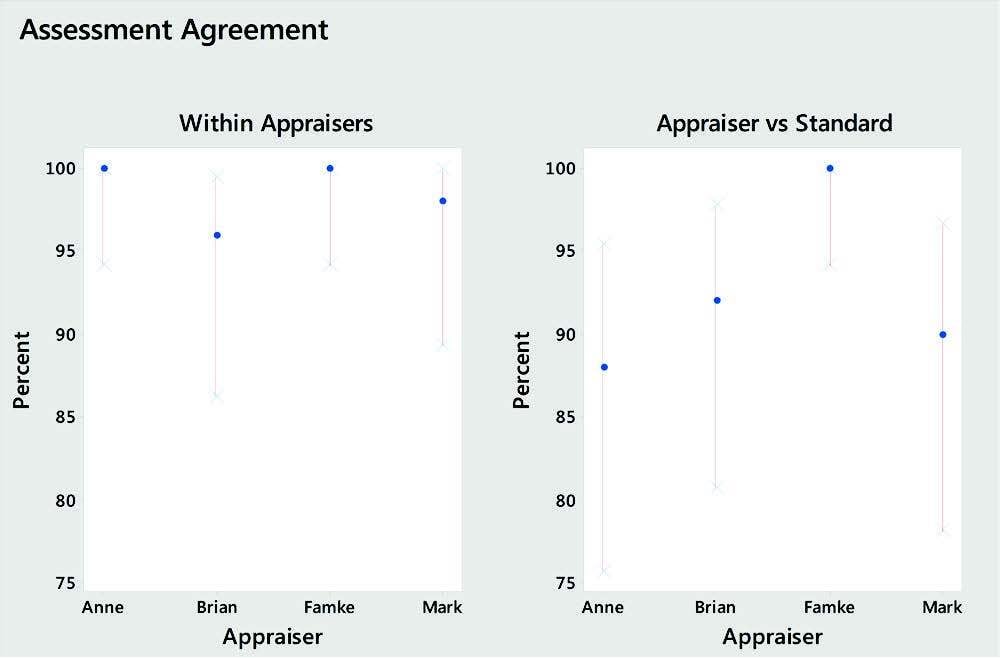
Another tool for making sure you can trust your data is attribute agreement analysis. Where Gage R&R assesses the reliability and reproducibility of numeric measurements, attribute agreement analysis assess categorical assessments, such as Pass or Fail. This tool shows whether people rating these categories agree with a known standard, with other appraisers, and with themselves.
5. Process Capability
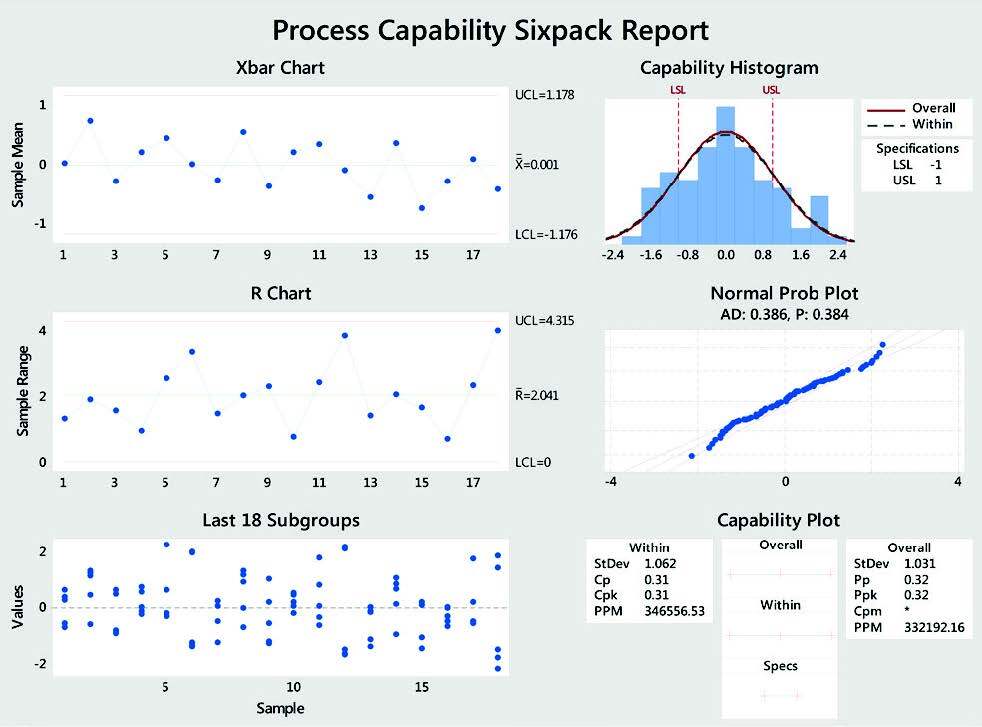
Nearly every process has an acceptable lower and/or upper bound. For example, a supplier's parts can’t be too large or too small, wait times can’t extend beyond an acceptable threshold, fill weights need to exceed a specified minimum. Capability analysis shows you how well your process meets specifications and provides insight into how you can improve a poor process. Frequently cited capability metrics include Cpk, Ppk, defects per million opportunities (DPMO), and Sigma level.
Conclusion
Six Sigma can bring significant benefits to any business, but reaping those benefits requires the collection and analysis of data so you can understand opportunities for improvement and make significant and sustainable changes.
The success of Six Sigma projects often depends on practitioners who are highly skilled experts in many fields, but not statistics. But with a basic understanding of the most commonly used Six Sigma statistics and easy-to-use statistical software, you can handle the statistical tasks associated with improving quality, and analyze your data with confidence.