


If your work involves quality improvement, you've at least heard of Design of Experiments (DOE). You probably know it's the most efficient way to optimize and improve your process. But many of us find DOE intimidating, especially if it's not a tool we use often. How do you select an appropriate design, and ensure you've got the right number of factors and levels? And after you've gathered your data, how do you pick the right model for your analysis?
One way to get started with DOE is the Assistant in Minitab Statistical Software. When you have many factors to evaluate, the Assistant will walk you through a DOE to identify which factors matter the most (screening designs) . Then the Assistant can guide you through a designed experiment to fine-tune the important factors for maximum impact (optimization designs) .If you're comfortable enough to skip the Assistant, but still have some questions about whether you're approaching your DOE the right way, consider the following tips from Minitab's technical trainers. These veterans have done a host of designed experiments, both while working with Minitab customers and in their careers in before they became Minitab trainers.
1. Identify the right variable space to study with exploratory runs.
Performing exploratory runs before doing the main experiment can help you identify the settings of your process as performance moves from good to bad. This can help you determine the variable space to conduct your experiment that will yield the most beneficial results.
2. Spread control runs throughout the experiment to measure process stability.
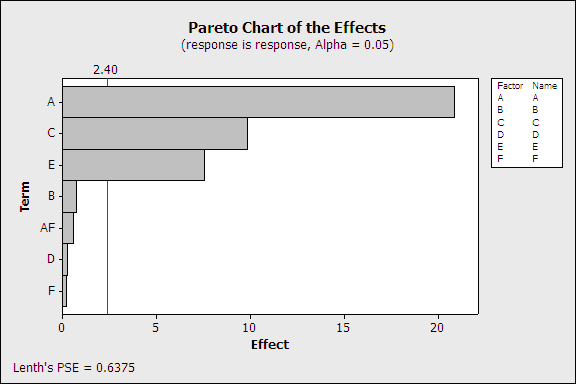
3. Identify the biggest problems with Pareto analysis.
4. Improve power by expanding the range of input settings.

5. Fractionate to save runs, focusing on Resolution V designs.
In many cases, it's beneficial to choose a design with ½ or ¼ of the runs of a full factorial. Even though effects could be confounded or confused with each other, Resolution V designs minimize the impact of this confounding which allows you to estimate all main effects and two-way interactions. Conducting fewer runs can save money and keep experiment costs low.

6. Improve the power of your experiment with replicates.
Power is the probability of detecting an effect on the response, if that effect exists. The number of replicates affects your experiment's power. To increase the chance that you will be successful identifying the inputs that affect your response, add replicates to your experiment to increase its power.

7. Improve power by using quantitative measures for your response.
Reducing defects is the primary goal of most experiments, so it makes sense that defect counts are often used as a response. But defect counts are a very expensive and unresponsive output to measure. Instead, try measuring a quantitative indicator related to your defect level. Doing this can decrease your sample size dramatically and improve the power of your experiment.
8. Study all variables of interest and all key responses.
Factorial designs let you take a comprehensive approach to studying all potential input variables. Removing a factor from the experiment slashes your chance of determining its importance to zero. With the tools available in statistical software such as Minitab to help, you shouldn't let fear of complexity cause you to omit potentially important input variables.