


Easy access to the right tools makes any task easier. That simple idea has made the Swiss Army knife essential for adventurers: just one item in your pocket gives you instant access to dozens of tools when you need them.
If your current adventures include analyzing data, the multifaceted Editor menu in Minitab Statistical Software is just as essential.
Minitab’s Dynamic Editor Menu
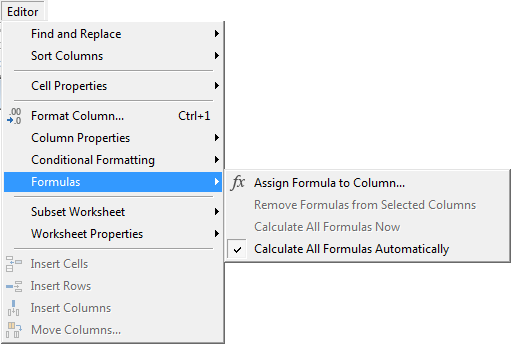
Whether you’re organizing a data set, sifting through Session window output, or perfecting a graph, the Editor menu adapts so that you never have to search for the perfect tool.
The Editor menu only contains tools that apply to the task you're engaged in. When you’re working with a data set, the menu contains only items for use in the worksheet. When a graph is active, the menu contains only graph-related tools. You get the idea.
Graphing
When a graph window is active, the Editor menu contains over a dozen graph tools. Here are a few of them.
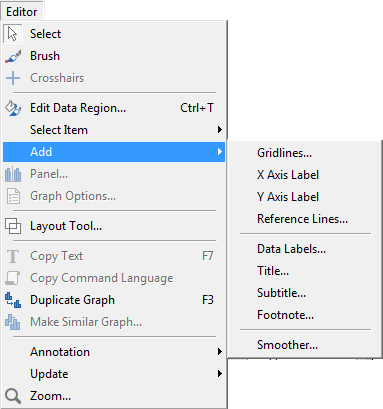
ADD
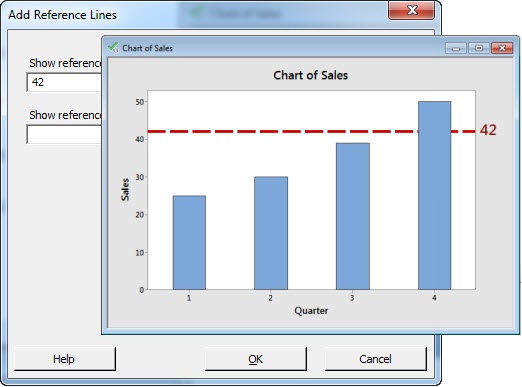
Use Editor > Add to add reference lines, labels, subtitles, and much more to your graphs. The contents of the Add submenu will change depending on the type of graph you're editing.
MAKE SIMILAR GRAPH
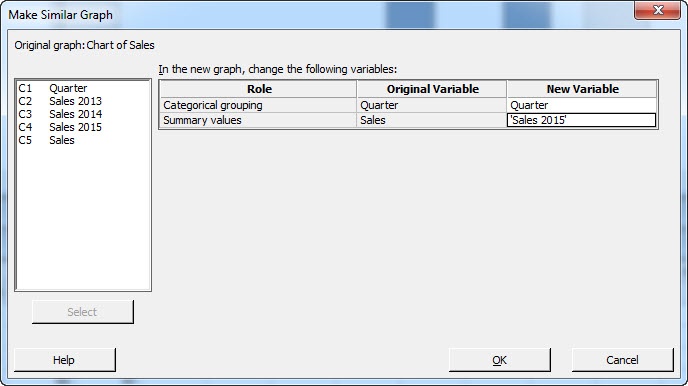
The editing features in Minitab graphs make it easy to create a graph that looks just right. But it may not be easy to reproduce that look a few hours (or a few months) later.
With most graphs, you can use Editor > Make Similar Graph to produce another graph with the same edits, but with new variables.
Entering data and organizing your worksheet
When a worksheet is active, the Editor menu contains tools to manipulate both the layout and contents of your worksheet. You can add column descriptions; insert cells, columns or rows; and much more, including the items below.
VALUE ORDER
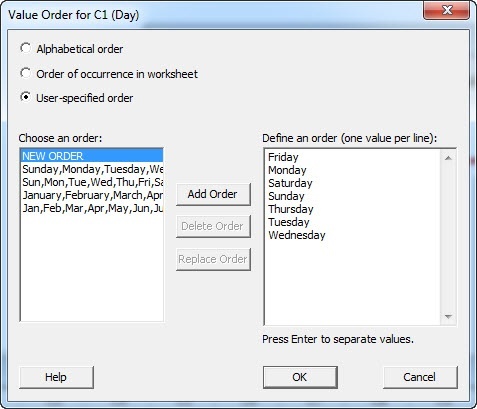
By default, Minitab displays text data alphabetically in output. But sometimes a different order is more appropriate (for example, “Before” then “After”, instead of alphabetical order). Use Editor > Column > Value Order to ensure that your graphs and other output appear the way that you intend.
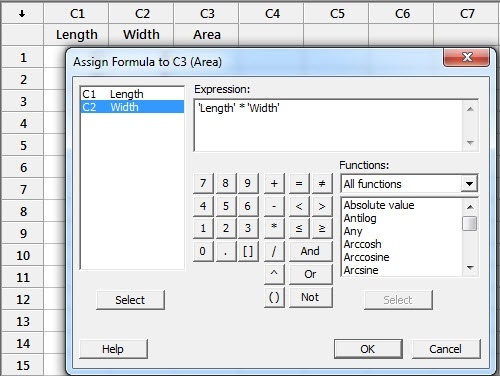
ASSIGN FORMULA TO COLUMN
You can assign a formula to a worksheet column that updates when you add or change data.
Session window
As the repository for output, the Session window is already an important component of any Minitab project, but the Editor menu makes it even more powerful.
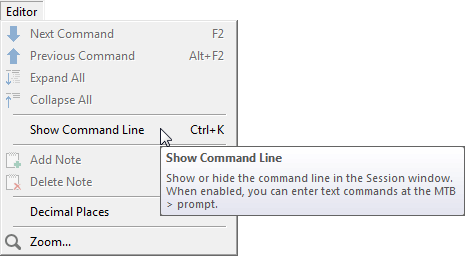
SHOW COMMAND LINE
For example, most users rely on menus to run analyses, but you can extend the functionality of Minitab and save time on routine tasks with Minitab macros. If you select the "Show Command Line" option, you'll see the command language generated with each analysis, which opens the door to macro writing.
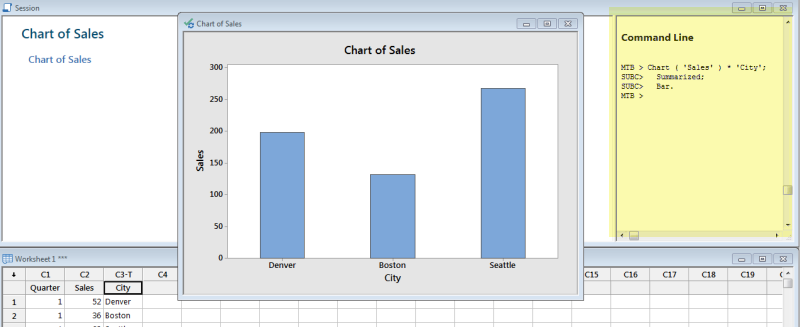
In previous versions of Minitab, the Command Line appeared in the Session window. In Minitab 18, the Command Line appears in an another pane, which keeps the Session window output clean and displays all of the commands together. The new Command Line pane is highlighted in the screen shot below:
NEXT COMMAND / PREVIOUS COMMAND / EXPAND ALL / COLLAPSE ALL
After you run several analyses, you may have a great deal of output in your Session window. This group of items makes it easy to find the results that you want, regardless of project size.
Next Command and Previous Command will take you back or forward one step from the currently selected location in your output.
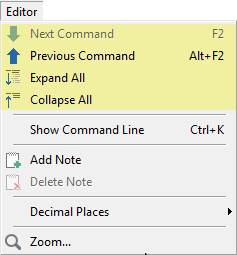
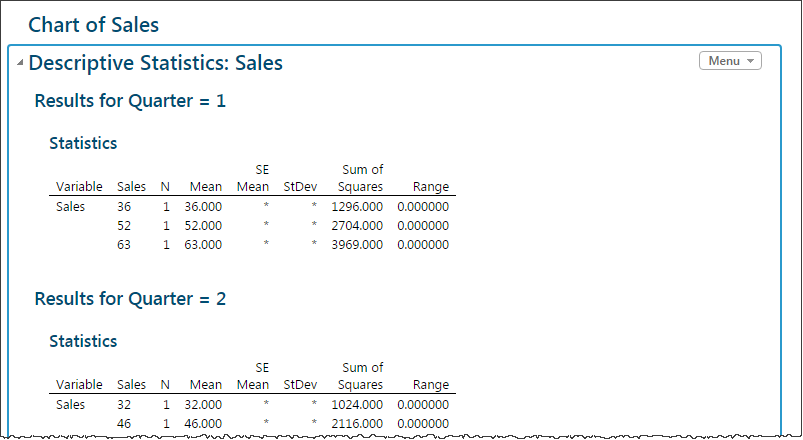
Expand All and Collapse All capitalize on a new feature in Minitab 18's redesigned Session window. Now you can select individual components of your output and choose whether to display all of the output (Expanded), or only the output title (Collapsed). Here's an example of an expanded output item:
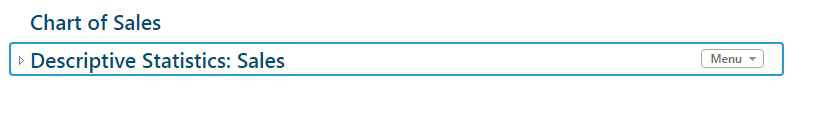
 And here's how the same output item appears when collapsed:
When you have a lot of output items in the session window, the "Collapse All" function can make it extremely fast to scroll through them and find exactly the piece of your analysis you need at any given moment.
Graph brushing
Graph exploration sometimes calls for graph brushing, which is a powerful way to learn more about the points on a graph that interest you. Here are two of the specialized tools in the Editor menu when you are in “brushing mode”.
SET ID VARIABLES
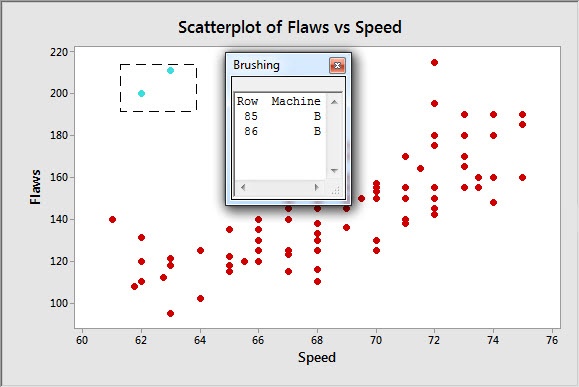
It’s easy to spot an outlier on a graph, but do you know why it’s an outlier? Setting ID variables allows you to see all of the information that your dataset contains for an individual observation, so that you can uncover the factors that are associated with its abnormality.
CREATE INDICATOR VARIABLE
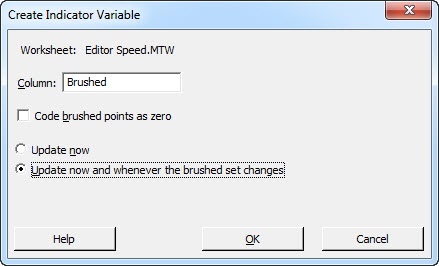
As you brush points on a graph, an indicator variable “tags” the observations in the worksheet. This enables you to identify these points of interest when you return to the worksheet.
Putting the Dynamic Menu Editor to Use
Working on a Minitab project can feel like many jobs rolled into one—data wrestler, graph creator, statistical output producer. Each task has its own challenges, but in every case you can reach for the Editor menu to locate the right tools.