One of my favorite bloggers about the application of statistics in health care is David Kashmer, an MD and MBA who runs and writes for the Business Model Innovation in Surgery blog. If you have an interest in how quality improvement methods like Lean and Six Sigma can be applied to healthcare, check it out.
A while back, Dr. Kashmer penned a column called "How to Measure a Process When There's No Metric," in which he discusses how you can use the measurement systems analysis method called Gage R&R (or gauge R&R) to create your own measurement tools and validate them as useful metrics. (I select the term “useful” here deliberately: a metric you’ve devised could be very useful in helping you assess your situation, but might not meet requirements set by agencies, auditors, or other concerned parties.)
I thought I would use this post to show you how you can use the Assistant in Minitab Statistical Software to do this.
How Well Are You Supervising Residents?
Kashmer posits a scenario in which state regulators assert that your health system's ability to oversee residents is poor, but your team believes residents are well supervised. You want to assess the situation with data, but you lack an established way to measure the quality of resident supervision. What to do?
Kashmer says, "You decide to design a tool for your organization. You pull a sample of charts and look for commonalities that seem to display excellent supervision versus poor supervision."
So you work with your team to come up with a tool that uses a 0 to 10 scale to rate resident supervision, based on various factors appearing on a chart. But how do you know if the tool will actually help you assess the quality of resident supervision?
This is where gage R&R comes in. The gage refers to the tool or instrument you're testing, and the R&R stands for reproducibility and repeatability. The analysis will tell you whether different people who use your tool to assess resident supervision (the gauge) will reach the same conclusion (reproducibility) and do it consistently (repeatability).
Collecting Data to Evaluate the Ability to Measure Accurately
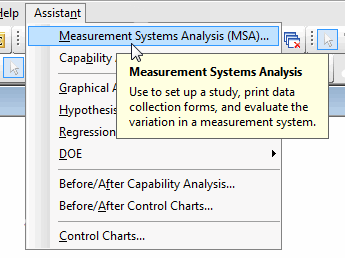
We're going to use the Assistant in Minitab Statistical Software to help us. If you're not already using it, you can download a 30-day trial version for free so you can follow along. Start by selecting Assistant > Measurement Systems Analysis... from the menu:
Follow the decision tree...
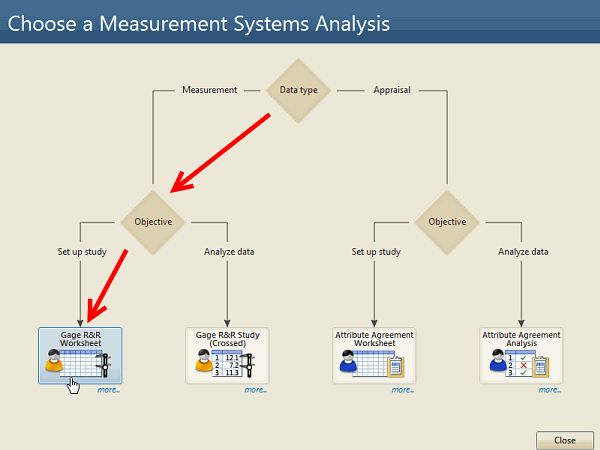
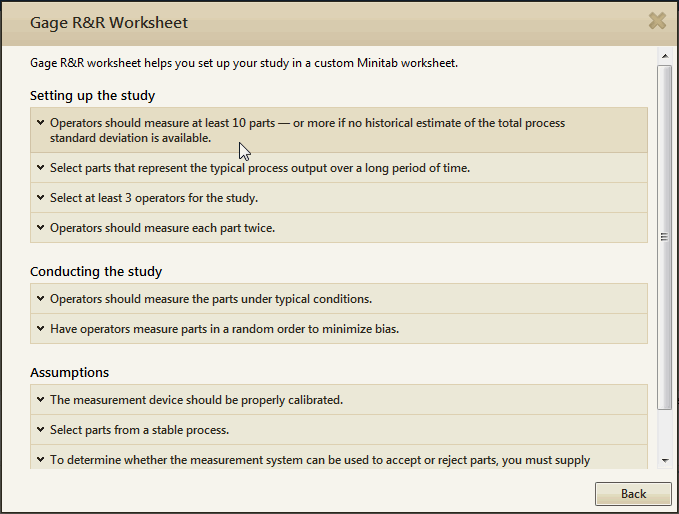
If you're not sure about what you need to do in a gage R&R, clicking the more... link gives you requirements, assumptions, and guidelines to follow:
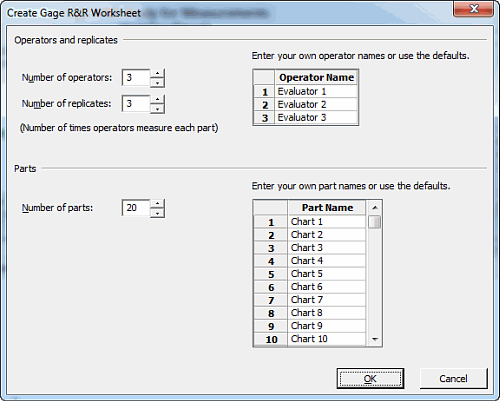
After a look at the requirements, you decide you will have three evaluators use your new tool to assess each of 20 charts 3 times, and so you complete the dialog box thus:
When you press "OK," the Assistant asks if you'd like to print worksheets you can use to easily gather your data:

Minitab also creates a datasheet for the analysis. All you need to do is enter the data you collect in the "Measurements" column:
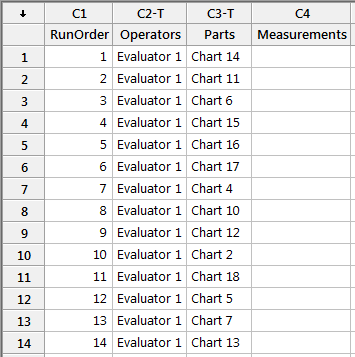
Note that the Assistant automatically randomizes the order in which each evaluator will examine the charts in each of their three judging sessions.
Now we're ready to gather the data to verify the effectiveness of our new metric for assessing the quality of patient supervision. Come back for Part 2, where we'll analyze the collected data!


