


In my previous post, I showed you how to set up data collection for a gage R&R analysis using the Assistant in Minitab Statistical Software. In this case, the goal of the gage R&R study is to test whether a new tool provides an effective metric for assessing resident supervision in a medical facility.
As noted in that post, I'm drawing on one of my favorite bloggers about health care quality, David Kashmer of the Business Model Innovation in Surgery blog, and specifically his column "How to Measure a Process When There's No Metric."
An Effective Measure of Resident Supervision?
In one scenario Kashmer presents, state regulators and hospital staff disagree about a health system's ability to oversee residents. In the absence of an established way to measure resident supervision, the staff devises a tool that uses a 0 to 10 scale to rate resident supervision.
Now we're going to analyze the Gage R&R data to test how effectively and reliably the new tool measures what we want it to measure. The analysis will evaluate whether different people who use the tool (the gauge) reach the same conclusion (reproducibility) and do it consistently (repeatability).
To get data, three evaluators used the tool to assess each of 20 charts three times each, and recorded their score for each chart in the worksheet we produced earlier. (You can download the completed worksheet here if you're following along in Minitab.)
Now we're ready to analyze the data.
Evaluating the Ability to Measure Accurately
Once again, we can turn to the Assistant in Minitab Statistical Software to help us. If you're not already using it, your can download a 30-day trial version for free so you can follow along. Start by selecting Assistant > Measurement Systems Analysis... from the menu:
In my earlier post, we used the Assistant to set up this study and make it easy to collect the data we need. Now that we've gathered the data, we can follow the Assistant's decision tree to the "Analyze Data" option.
Selecting the right items for the Assistant's Gage R&R dialog box couldn't be easier—when you use the datasheet the Assistant generated, just enter "Operators" for Operators, "Parts" for Parts, and "Score" for Measurements.
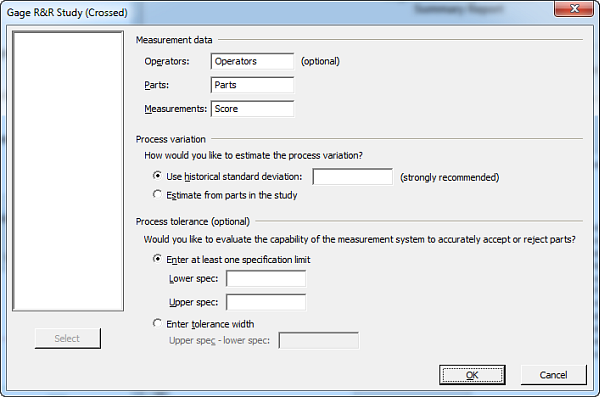
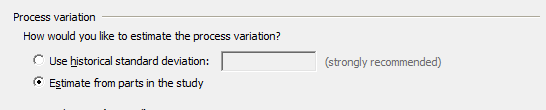
Before we press OK, though, we need to tell the Assistant how to estimate process variation. When Gage R&R is performed in a manufacturing context, historic data about the amount of variation in the output of the process being studied is usually available. Since this is the first time we're analyzing the performance of the new tool for measuring the quality of resident supervision, we don't have an historical standard deviation, so we will tell the Assistant to estimate the variation from the data we're analyzing.
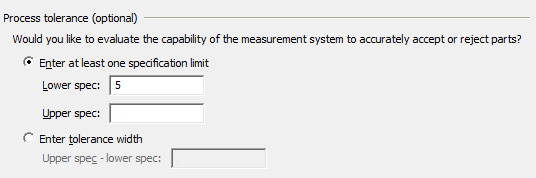
The Assistant also asks for an upper or lower specification limit, or tolerance width, which is the distance from the upper spec limit to the lower spec limit. Minitab uses this to calculate %Tolerance, an optional statistic used to determine whether the measurement system can adequately sort good from bad parts—or in this case, good from bad supervision. For the sake of this example, let's say in designing the instrument you have selected a level of 5.0 as the minimum acceptable score.
When we press OK, the Assistant analyzes the data and presents a Summary Report, a Variation Report, and a Report Card for its analysis. The Summary Report gives us the bottom line about how well the new measurement system works.
The first item we see is a bar graph that answers the question, "Can you adequately assess process performance?" The Assistant's analysis of the data tells us that the system we're using to measure patient supervision can indeed assess the resident supervision process.
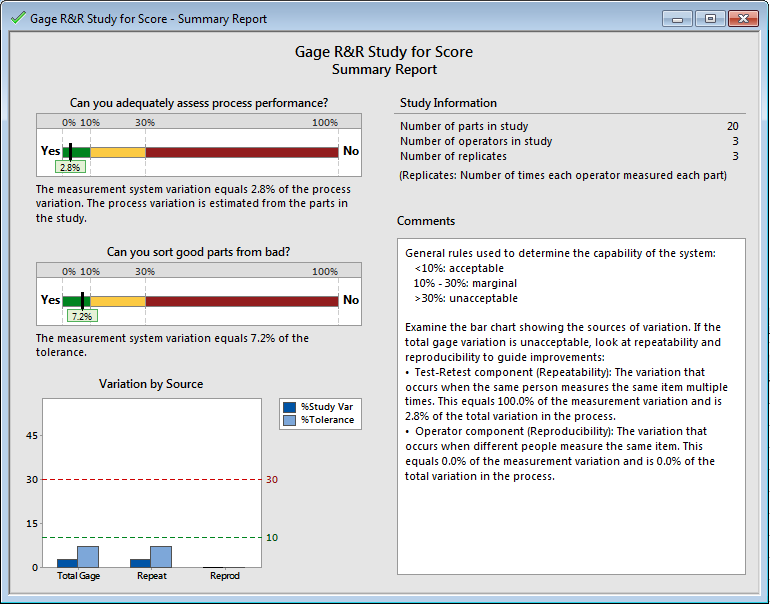
The second bar graph answers the question "Can you sort good parts from bad?" In this case, we're evaluating patient supervision rather than parts, but the Analysis shows that the system is able to distinguish charts that indicate acceptable resident supervision from those that do not.
For both of these charts, less than 10% of the observed variation in the data could be attributed to the measurement system itself—a very good result.
Measuring the "Unmeasurable"
I can't count the number of times I've heard people say that they can't gather or analyze data about a situation because "it can't be measured." In most cases, that's just not true. Where a factor of interest—"service quality," say—is tough to measure directly, we can usually find measurable indicator variables that can at least give us some insight into our performance.
I hope this example, though simplified from what you're likely to encounter in the real world, shows how it's possible to demonstrate the effectiveness of a measurement system when one doesn't already exist. Even for outcomes that seem hard to quantify, we can create measurement systems to give us valuable data, which we can then use to make improvements.
What kinds of outcomes would you like to be able to measure in your profession? Could you use Gage R&R or another form of measurement system analysis to get started?