A few weeks ago, on National Pierogi Day, I explained how you could use Minitab Statistical Software to design an experiment that would let you assess the impact of different factors on the mushiness of pierogies.
We created a 1/4 fraction factorial design, which let us look at the effects of five factors. We had to make a trade-off: this design would not let us look at how interactions between our factors affected mushiness, but we could evaluate the main effects in only 8 runs.

The A, B, C, D, and E columns represent our variables. Each -1 represents the low value and each 1 represents the high value for the variable. So the variable settings for our first run (i.e., the first row) would be:
A. Thin casing
B. Bountiful filling
C. Ultra-starchy cheese-potato ratio
D. Sparse butter and onions
E. Super-hot pan
So assume that we followed the settings laid out in the next seven rows, or runs, of the experiment. We cooked (and ate) eight batches of pierogies made under different experimental conditions, and evaluated and recorded the mushiness of each batch. Assume that we asked all family members to sample the pierogies and assess their mushiness on a 100-point scale, and then we averaged the responses to form our final mushiness rating. We record our data in a new column in our Minitab worksheet, giving us something like this:

Now let's look at what we can learn by analyzing the data we collected. (First, a word of caution: my grandmother would have my head if I gave out any real information about her pierogi recipe, so all the settings and results related here are for demonstration purposes only. The data have been falsified. Therefore, we cannot be held responsible if you make and eat 8 batches of pierogies under these experimental conditions!)
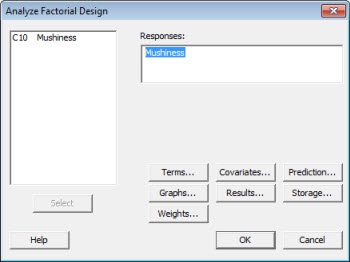
To see what our data say, we'll choose Stat > DOE > Factorial > Analyze Factorial Design in Minitab. We enter the name of our data column, "Mushiness," as the response:

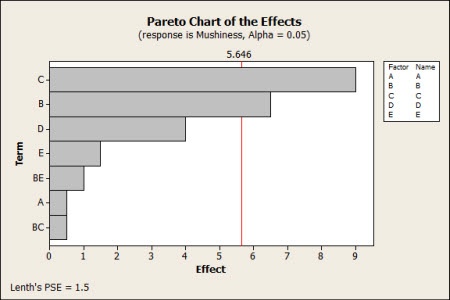
We'll also click on the "Graphs" button in this dialog, and ask it to give us a Pareto chart of the factor effects. When we analyze the data, we get the following graph:

The chart reveals that of the five factors we varied in our eight batches of pierogies, only C (cheese/potato ratio of the filling) and B (amount of filling in the pierogi) had a statistically significant relationship with the mushiness result.
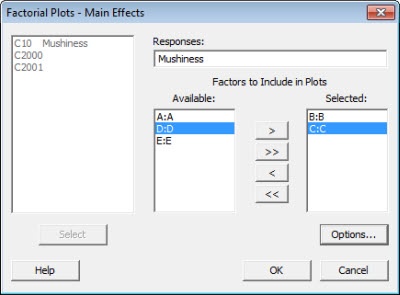
But how can we use this information to adjust our settings so we get pierogies that are less (or more) mushy? Go to Stat > DOE > Factorial > Factorial Plots. Choose "Main Effects Plot" and click "Setup..." to bring up this dialog:

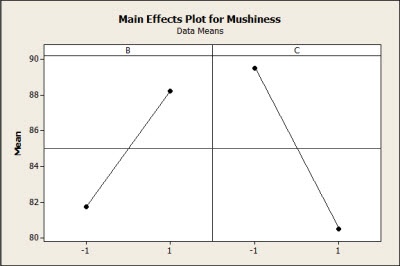
Since B and C were the only significant factors in our experiment, we select those as the factors to include in our plots. Minitab gives us the following:

The graph shows us the relationship between each factor and pierogi mushiness. If we want pierogies that are less mushy, we want to choose the lower amount of filling (B), and the higher cheese-potato ratio (C).
I hope this light-hearted experiment gives you a sense of what a powerful tool Design of Experiments is, and why it's so valuable across industries and professions.
But this simple experiment barely scratches the surface of what can be done with designed experiments in Minitab. For instance, Minitab's Response Optimizer tool can let you fine-tune the settings for several factors simultaneously to get the best settings for a process. That's invaluable in manufacturing, where even minute changes in settings can make a difference in product quality and/or the amount of materials used in the process...but that's a topic for a future blog post!


