


In an earlier post, I shared an overview of acceptance sampling, a method that lets you evaluate a sample of items from a larger batch of products (for instance, electronics components you've sourced from a new supplier) and use that sample to decide whether or not you should accept or reject the entire shipment.
There are two approaches to acceptance sampling. If you do it by attributes, you count the number of defects or defective items in the sample, and base your decision about the entire lot on that. The alternative approach is acceptance sampling by variables, in which you use a measurable characteristic to evaluate the sampled items. Doing it by attributes is easier, but sampling by variables requires smaller sample sizes.
In this post, we'll do acceptance sampling by attributes using Minitab Statistical Software. If you're not already using it and you'd like to follow along, you can get our free 30-day trial version.
Getting Started with Acceptance Sampling by Attributes
You manage components for a large consumer electronics firm. In that role, you're responsible for sourcing the transistors, resistors, integrated circuits, and other components your company uses in its finished products. You're also responsible for making sure your vendors are supplying high-quality products, and rejecting any batches that don't meet your standards.
Recently, you've been hearing from the assembly managers about problems with one of your suppliers of capacitors. You order these components in batches of 1,000, and it's just not feasible to inspect every individual item coming in. When the next batch of capacitors arrives from this supplier, you decide to use sampling so you can make a data-driven decision to either accept or reject the entire lot.
Before you can devise your sampling plan, you need to know what constitutes an acceptable quality level (AQL) for a batch of capacitors, and what is a rejectable quality level (RQL). As you might surmise, these are figures that need to be discussed with and agreed to by your supplier. You'll also need to settle on levels of the "producer's risk," which is the probability of incorrectly rejecting a lot that should have been accepted, and the "consumer's risk," which the probability that a batch which should have been rejected is accepted. In many cases, the Consumer's Risk is set at a higher level than the Producer's Risk.
Your agreement with the supplier is that the AQL is 1%, and the RQL is 8%. The producer's risk has been set at 5%, which means that about 95% of the time, you'll correctly accept a lot with a defect level of 1% or lower. You've agreed to accept a consumer's risk level of 10%, which means that about 90% of the time you would correctly reject a lot that has a defect level of 8% or higher.
Creating Your Plan for Acceptance Sampling by Attributes
Now we can use Minitab to determine an appropriate sampling plan. 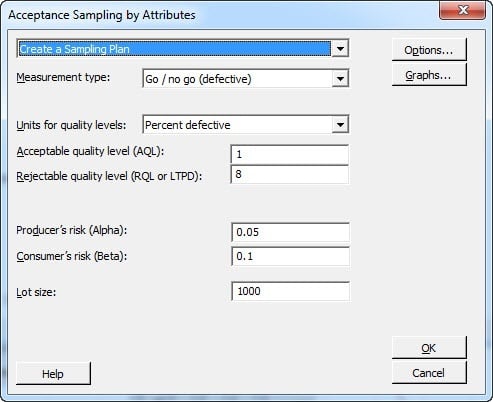
- Choose Stat > Quality Tools > Acceptance Sampling by Attributes.
- Choose Create a sampling plan.
- In Measurement type, choose Go / no go (defective).
- In Units for quality levels, choose Percent defective.
- In Acceptable quality level (AQL), enter 1. In Rejectable quality level (RQL or LTPD), enter 8.
- In Producer's risk (Alpha), enter 0.05. In Consumer's risk (Beta), enter 0.1.
- In Lot size, enter 1000.
- Click OK.
Minitab produces the following output in the Session Window:
Interpreting the Acceptance Sampling by Attributes Plan
For each lot of 1,000 capacitors, you need to randomly select and inspect 65. If you find more than 2 defectives among these 65 capacitors, you should reject the entire lot. If you find 2 or fewer defective items, accept the entire lot.
Minitab plots an Operating Characteristic Curve to show you the probability of accepting lots at various incoming quality levels. In this case, the probability of acceptance at the AQL (1%) is 0.972, and the probability of rejecting is 0.028. When the sampling plan was set up, you and your supplier agreed that lots of 1% defective would be accepted approximately 95% of the time to protect the producer.
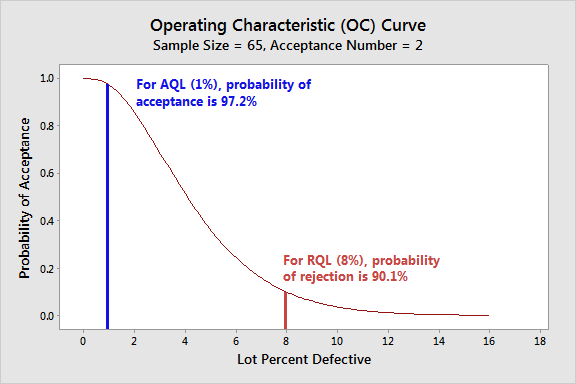
The probability of accepting a batch of capacitors at the RQL (8%) is 0.099 and the probability of rejecting is 0.901. The consumer and supplier agreed that lots of 8% defective would be rejected most of the time to protect the consumer.
What Happens If a Lot Gets Rejected?
When the next batch of capacitors arrives at the dock, you pick out 65 at random and test them. Five of the 65 samples are defective.
Based on your plan, you reject the lot. Now what? Typically, the supplier will need to take some corrective action, such as inspecting all units and reworking or replacing any that are defective.
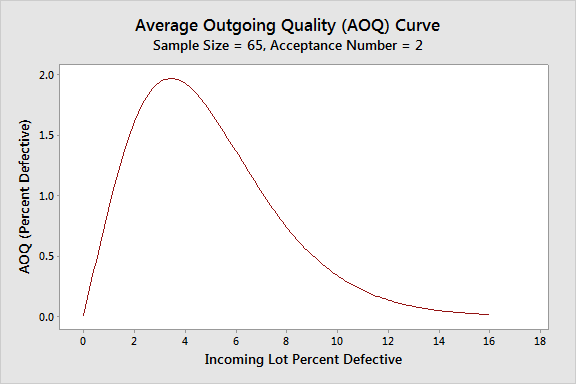
Minitab produces two graphs that can tell you more. If we assume that rejected lots will be 100% inspected and all defects rectified, the Average Outgoing Quality (AOQ) plot represents the relationship between the quality of incoming and outgoing materials. The Average Total Inspection (ATI) shows the correlation between the quality of incoming materials and the number of items that need to be inspected.
When incoming lots are very good or very bad, the outgoing quality will be good because poor lots get reinspected and fixed, and good lots are already good. In the graph below, the AOQ level is 1.4% at the AQL and 1.0% at the RQL. But when incoming quality is neither very good or very bad, the number of bad parts that gets through rises, so outgoing quality gets worse. The maximum % defective level for outgoing quality is called the Average Outgoing Quality Limit (AOQL). This figure is included in the session window output above, and you can see it in the graph below: At about 3.45% defective, Average Outgoing Quality Limit(AOQL) = 1.968, the worst-case outgoing quality level.
The ATI per lot represents the average number of capacitors you will need to inspect at a particular quality level.
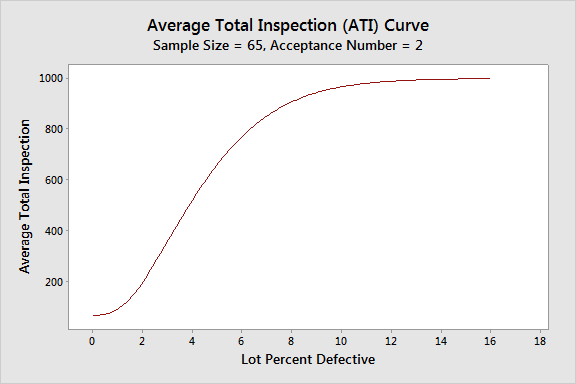
In the graph above, you can see that if the lot's actual % defective is 2%, the average total number of capacitors inspected per lot will approach 200 (including re-inspections after the supplier has rectified a rejected lot). If the quality level of 10% defective, the average total number of capacitors inspected per lot is 907.3.
Check out my earlier posts for a walk through of performing acceptance sampling by variables.