Now that we've seen how easy it is to create plans for acceptance sampling by variables, and to compare different sampling plans, it's time to see how to actually analyze the data you collect when you follow the sampling plan.
If you'd like to follow along and you're not already using Minitab, please download the free 30-day trial.
Collecting the Data for Acceptance Sampling by Variable
If you'll recall from the previous post, after comparing several different sampling plans, you decided that sampling 50 items from your next incoming lot of 1,500 LEDs would be the best option to satisfy your supervisor's desire to sample as few items as possible while at the same time providing sufficient protection to you and your supplier. That protection stems from an acceptable probability that lots will not be accepted or rejected in error. Under this plan, you have just a 7% chance of rejecting a good lot, and an 87% chance to rejecting a poor lot.
So, on the day your next shipment of LEDs arrives, you select 50 of them and carefully measure the soldering leads. To make sure the sampling process will be effective, you're diligent about taking samples from throughout the entire lot, at random. You record your measurements and place the data into a Minitab worksheet.
Analyzing Acceptance Sampling by Variable Data
This time, when you go to Stat > Quality Tools > Acceptance Sampling by Variables, choose the Accept/Reject Lot... option.

The goal of this analysis is to determine whether you should accept or reject this latest batch of LEDs, based on your sample data. If the calculated Z value is greater than the critical distance (3.5132), you will accept the entire lot. Otherwise, the lot goes back to your supplier for rework and correction.
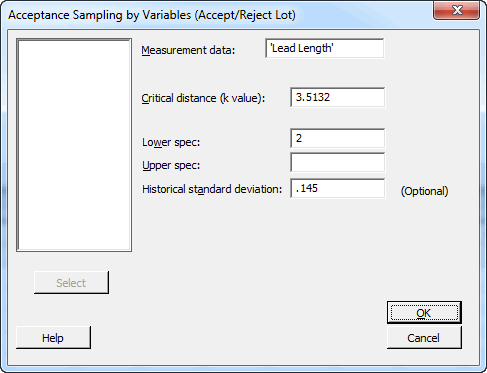
In Measurement data, enter 'Lead Length'. In Critical distance (k value), enter 3.5132. In Lower spec, enter 2. Finally, for Historical standard deviation, enter 0.145. Your dialog box will look like this:

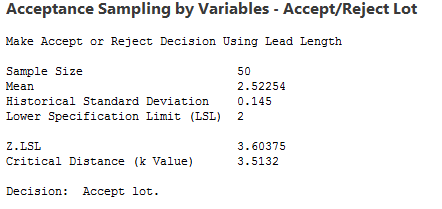
When you click OK, the Session Window provides the following output:

Interpreting the Acceptance Sampling Output
From the measurements of the 50 LEDs, that you sampled, the mean length of the solder leads is 2.52254 centimeters, and the historical standard deviation is 0.145 inches. The lower specification of the pipe thickness is 2 inches.
When you created the sampling plan, the critical distance was determined to be 3.5132. Because this is smaller than the calculated Z.LSL (3.60375), you will accept the lot of 1,500 LEDs.


