


A while back, I offered an overview of process capability analysis that emphasized the importance of matching your analysis to the distribution of your data.
If you're already familiar with different types of distributions, Minitab makes it easy to identify what type of data you're working with, or to transform your data to approximate the normal distribution.
But what if you're not so great with probability distributions, or you're not sure about how or even if you should transform your data? You can still do capability analysis with the Assistant in Minitab Statistical Software. Even if you're a stats whiz, the Assistant's easy-to-follow output can make the task of explaining your results much easier to people who don't share your expertise.
Let's walk through an example of capability analysis with non-normal data, using the Assistant.
The Easy Way to Do Capability Analysis on Non-normal Data
For this example, we'll use a data set that's included with Minitab Statistical Software. (If you're not already using Minitab, download the free trial and follow along.) Click File > Open Worksheet, and then click the button labeled "Look in Minitab Sample Data folder." Open the dataset named Tiles.
This is data from a manufacturer of floor tiles. The company is concerned about the flexibility of the tiles, and the data set contains data collected on 10 tiles produced on each of 10 consecutive working days.
Select Assistant > Capability Analysis in Minitab:
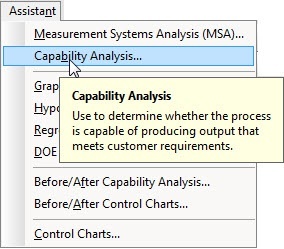
The Assistant presents you with simple decision tree that will guide you to the right kind of capability analysis:
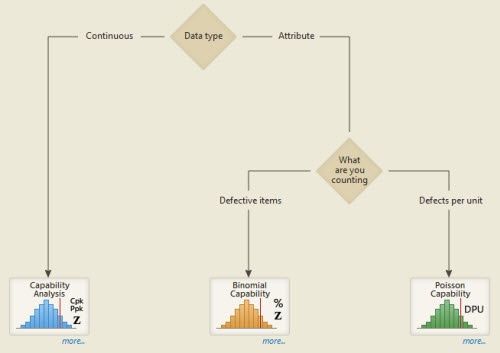
The first decision we need to make is what type of data we've collected—Continuous or Attribute. If you're not sure what the difference is, you can just click the "Data Type" diamond to see a straightforward explanation.
Attribute data involves counts and characteristics, while Continuous data involves measurements of factors such as height, length, weight, and so on, so it's pretty easy to recognize that the measurements of tile flexibility are continuous data. With that question settled, the Assistant leads us to the "Capability Analysis" button:
Clicking that button brings up the dialog shown below. Our data are all in the "Warping" column of the worksheet. The subgroup size is "10", since we measured 10 samples on each day. Enter "8" as the upper spec limit, because that's the customer's guideline.
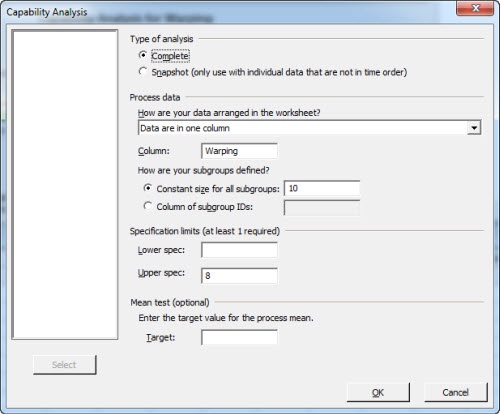
Then press OK.
Transforming Non-normal Data
Uh-oh—the Assistant immediately gives us a warning. Our data don't meet the assumption of normality:
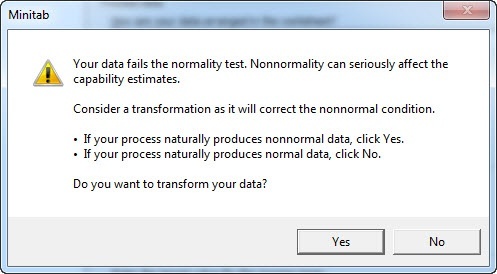
When you click "Yes," the Assistant will transform the data automatically (using the Box-Cox transformation) and continue the analysis. Once the analysis is complete, you'll get a Report Card that alerts you if there are potential issues with your analysis, a Diagnostic Report that assesses the stability of your process and the normality of your data, a detailed Process Performance Report, and a Summary Report that captures the bottom line results of your analysis and presents them in plain language.
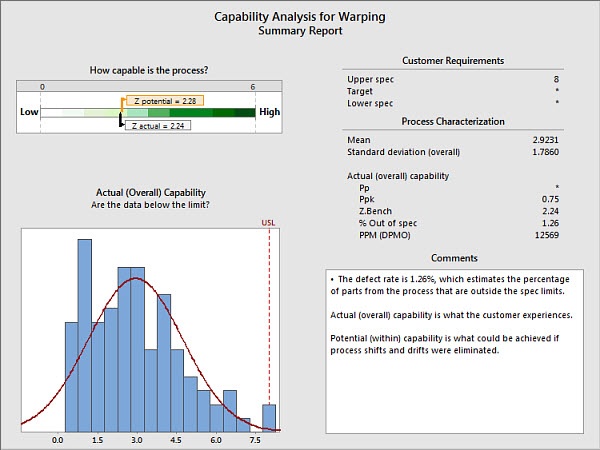
The Ppk of .75 is below the typical industry acceptability benchmark of 1.33, so this process is not capable. Looks like we have some opportunities to improve the quality of our process!
Comparing Before and After Capability Analysis Results
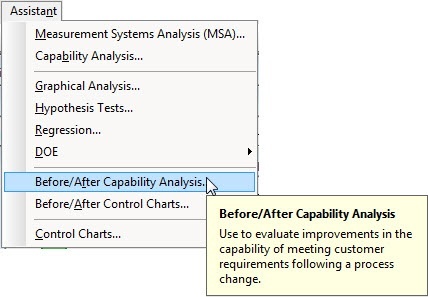
Once we've made adjustments to the process, we can also use the Assistant to see how much of an impact those changes have had. The Assistant's Before/After Capability Analysis is just what we need:
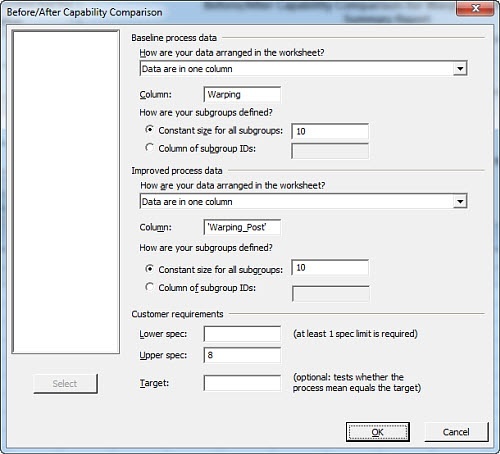
The dialog box for this analysis is very similar to that for the first capability analysis we performed, but this time we can select a column of data from before we made improvements (Baseline process data), and a column of data collected after our improvements were implemented:
Press OK and the Assistant will again check if you want to transform your data for normality before it proceeds with the analysis. Then it presents us with a series of reports that make it easy to see the impact of our changes. The summary report gives you the bottom line quickly.
The changes did affect the process variability, and this process now has a Ppk of 1.39, a vast improvement over the original value of .75, and well above the 1.33 benchmark for acceptability.
I hope this post helps you see how the Assistant can make performing capability analyses easier, and that you'll be able to get more value from your process data as a result.
WORK SMARTER WITH MINITAB STATISTICAL SOFTWARE. CHECK OUT TRAINING OPTIONS TODAY!
