


Banned! In February 2015, editor David Trafimow and associate editor Michael Marks of the Journal of Basic and Applied Social Psychology declared that the null hypothesis statistical testing procedure is invalid. They promptly banned P values, confidence intervals, and hypothesis testing from the journal.
The journal now requires descriptive statistics and effect sizes. They also encourage large sample sizes, but they don’t require it.
This is the first of two posts in which I focus on the ban. In this post, I’ll start by showing how hypothesis testing provides crucial information that descriptive statistics alone just can't convey. In my next post, I’ll explain the editors' rationale for the ban—and why I disagree with them.
P Values and Confidence Intervals Are Valuable!
It’s really easy to show how P values and confidence intervals are valuable. Take a look at the graph below and determine which study found a true treatment effect and which one didn’t. The difference between the treatment group and the control group is the effect size, which is what the editors want authors to focus on.
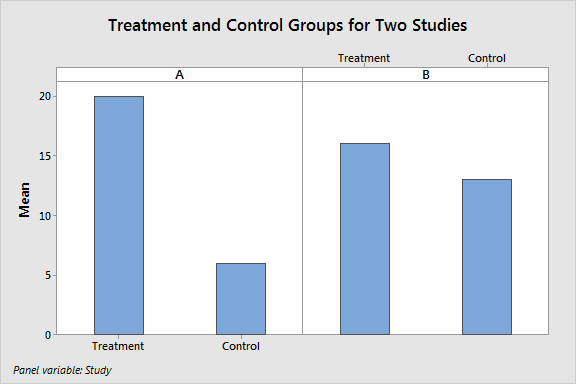
Can you tell? The truth is that the results from both of these studies could represent either a true treatment effect or a random fluctuation due to sampling error.
So, how do you know? There are three factors at play.
- Effect size: The larger the effect size, the less likely it is to be a random fluctuation. Clearly, Study A has a larger effect size. The large effect seems significant, but it’s not enough by itself.
- Sample size: A larger sample size allows you to detect smaller effects. If the sample size for Study B is large enough, its smaller treatment effect may very well be real.
- Variability in the data: The greater the variability, the more likely you’ll see large differences between the experimental groups due to random sampling error. If the variability in Study A is large enough, its larger difference may be attributable to random error rather than a treatment effect.
The effect size from either study could be meaningful, or not, depending on the other factors. As you can see, there are scenarios where the larger effect size in Study A can be random error while the smaller effect size in Study B can be a true treatment effect.
Presumably, these statistics will all be reported under the journal's new focus on effect size and descriptive statistics. However, assessing different combinations of effect sizes, sample sizes, and variability gets fairly complicated. The ban forces journal readers to use a subjective eyeball approach to determine whether the difference is a true effect. And this is just for comparing two means, which is about as simple as it can get! (How the heck would you even perform multiple regression analysis with only descriptive statistics?!)
Wouldn’t it be nice if there was some sort of statistic that incorporated all of these factors and rolled them into one objective number?
Hold on . . . that’s the P value! The P value provides an objective standard for everyone assessing the results from a study.
Now, let’s consider two different experiments that have studied the same treatment and have come up with the following two estimates of the effect size.
| Effect Size Study C | Effect Size Study D |
|---|---|
| 10 | 10 |
Which estimate is better? It is pretty hard to say which 10 is better, right? Wouldn’t it be nice if there was a procedure that incorporated the effect size, sample size, and variability to provide a range of probable values and indicate the precision of the estimate?
Oh wait . . . that’s the confidence interval!
If we create the confidence intervals for Study C [-5 25] and Study D [8 12], we gain some very valuable information. The confidence interval for Study C is both very wide and contains 0. This estimate is imprecise, and we can't rule out the possibility of no treatment effect. We're not learning anything from this study. On the other hand, the estimate from Study D is both very precise and statistically significant.
The two studies produced the same point estimate of the effect size, but the confidence interval shows that they're actually very different.
Focusing solely on effect sizes and descriptive statistics is inadequate. P values and confidence intervals contribute truly important information that descriptive statistics alone can’t provide. That's why banning them is a mistake.
See a graphical explanation of how hypothesis tests work.
If you'd like to see some fun examples of hypothesis tests in action, check out my posts about the Mythbusters!
- Busting the Mythbusters with Statistics: Are Yawns Contagious?
- Using Hypothesis Tests to Bust Myths about the Battle of the Sexes
The editors do raise some legitimate concerns about the hypothesis testing process. In part two, I assess their arguments and explain why I believe a ban still is not justified.