


You’ve performed multiple linear regression and have settled on a model which contains several predictor variables that are statistically significant. At this point, it’s common to ask, “Which variable is most important?”
This question is more complicated than it first appears. For one thing, how you define “most important” often depends on your subject area and goals. For another, how you collect and measure your sample data can influence the apparent importance of each variable.
With these issues in mind, I’ll help you answer this question. I’ll start by showing you statistics that don’t answer the question about importance, which may surprise you. Then, I’ll move on to both statistical and non-statistical methods for determining which variables are the most important in regression models.
Don’t Compare Regular Regression Coefficients to Determine Variable Importance
Regular regression coefficients describe the relationship between each predictor variable and the response. The coefficient value represents the mean change in the response given a one-unit increase in the predictor. Consequently, it’s easy to think that variables with larger coefficients are more important because they represent a larger change in the response.
However, the units vary between the different types of variables, which makes it impossible to compare them directly. For example, the meaning of a one-unit change is very different if you’re talking about temperature, weight, or chemical concentration.
This problem is further complicated by the fact that there are different units within each type of measurement. For example, weight can be measured in grams and kilograms. If you fit models for the same data set using grams in one model and kilograms in another, the coefficient for weight changes by a factor of a thousand even though the underlying fit of the model remains unchanged. The coefficient value changes greatly while the importance of the variable remains constant.
Takeaway: Larger coefficients don’t necessarily identify more important predictor variables.
Don’t Compare P-values to Determine Variable Importance
The coefficient value doesn’t indicate the importance a variable, but what about the variable’s p-value? After all, we look for low p-values to help determine whether the variable should be included in the model in the first place.
P-value calculations incorporate a variety of properties, but a measure of importance is not among them. A very low p-value can reflect properties other than importance, such as a very precise estimate and a large sample size.
Effects that are trivial in the real world can have very low p-values. A statistically significant result may not be practically significant.
Takeaway: Low p-values don’t necessarily identify predictor variables that are practically important.
Do Compare These Statistics To Help Determine Variable Importance
We ruled out a couple of the more obvious statistics that can’t assess the importance of variables. Fortunately, there are several statistics that can help us determine which predictor variables are most important in regression models. These statistics might not agree because the manner in which each one defines "most important" is a bit different.
Standardized regression coefficients
I explained how regular regression coefficients use different scales and you can’t compare them directly. However, if you standardize the regression coefficients so they’re based on the same scale, you can compare them.
To obtain standardized coefficients, standardize the values for all of your continuous predictors. In Minitab, you can do this easily by clicking the Coding button in the main Regression dialog. Under Standardize continuous predictors, choose Subtract the mean, then divide by the standard deviation.
After you fit the regression model using your standardized predictors, look at the coded coefficients, which are the standardized coefficients. This coding puts the different predictors on the same scale and allows you to compare their coefficients directly. Standardized coefficients represent the mean change in the response given a one standard deviation change in the predictor.
Takeaway: Look for the predictor variable with the largest absolute value for the standardized coefficient.
Change in R-squared when the variable is added to the model last
Multiple regression in Minitab's Assistant menu includes a neat analysis. It calculates the increase in R-squared that each variable produces when it is added to a model that already contains all of the other variables.
Because the change in R-squared analysis treats each variable as the last one entered into the model, the change represents the percentage of the variance a variable explains that the other variables in the model cannot explain. In other words, this change in R-squared represents the amount of unique variance that each variable explains above and beyond the other variables in the model.
Takeaway: Look for the predictor variable that is associated with the greatest increase in R-squared.
An Example of Using Statistics to Identify the Most Important Variables in a Regression Model
The example output below shows a regression model that has three predictors. The text output is produced by the regular regression analysis in Minitab. I’ve standardized the continuous predictors using the Coding dialog so we can see the standardized coefficients, which are labeled as coded coefficients. You can find this analysis in the Minitab menu: Stat > Regression > Regression > Fit Regression Model.
The report with the graphs is produced by Multiple Regression in the Assistant menu. You can find this analysis in the Minitab menu: Assistant > Regression > Multiple Regression.
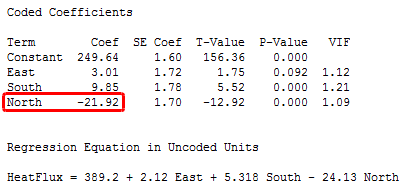
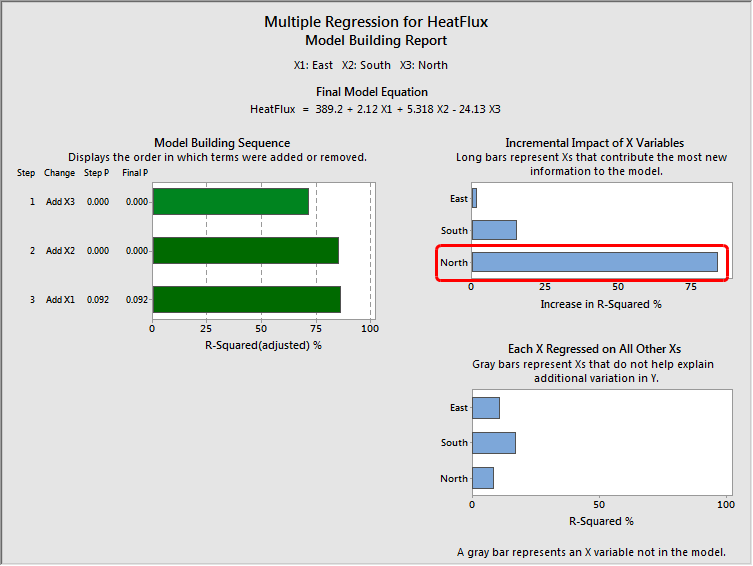
The standardized coefficients show that North has the standardized coefficient with the largest absolute value, followed by South and East. The Incremental Impact graph shows that North explains the greatest amount of the unique variance, followed by South and East. For our example, both statistics suggest that North is the most important variable in the regression model.
Caveats for Using Statistics to Identify Important Variables
Statistical measures can show the relative importance of the different predictor variables. However, these measures can't determine whether the variables are important in a practical sense. To determine practical importance, you'll need to use your subject area knowledge.
How you collect and measure your sample can bias the apparent importance of the variables in your sample compared to their true importance in the population.
If you randomly sample your observations, the variability of the predictor values in your sample likely reflects the variability in the population. In this case, the standardized coefficients and the change in R-squared values are likely to reflect their population values.
However, if you select a restricted range of predictor values for your sample, both statistics tend to underestimate the importance of that predictor. Conversely, if the sample variability for a predictor is greater than the variability in the population, the statistics tend to overestimate the importance of that predictor.
Also, consider the accuracy and precision of the measurements for your predictors because this can affect their apparent importance. For example, lower-quality measurements can cause a variable to appear less predictive than it truly is.
If your goal is to change the response mean, you should be confident that causal relationships exist between the predictors and the response rather just a correlation. If there is an observed correlation but no causation, intentional changes in the predictor values won’t necessarily produce the desired change in the response regardless of the statistical measures of importance.
To determine that there is a causal relationship, you typically need to perform a designed experiment rather than an observational study.
Non-Statistical Considerations for Identifying Important Variables
How you define “most important” often depends on your goals and subject area. While statistics can help you identify the most important variables in a regression model, applying subject area expertise to all aspects of statistical analysis is crucial. Real world issues are likely to influence which variable you identify as the most important in a regression model.
For example, if your goal is to change predictor values in order to change the response, use your expertise to determine which variables are the most feasible to change. There may be variables that are harder, or more expensive, to change. Some variables may be impossible to change. Sometimes a large change in one variable may be more practical than a small change in another variable.
“Most important” is a subjective, context sensitive characteristic. You can use statistics to help identify candidates for the most important variable in a regression model, but you’ll likely need to use your subject area expertise as well.
If you're just learning about regression, read my regression tutorial!