Data mining can be helpful in the exploratory phase of an analysis. If you're in the early stages and you're just figuring out which predictors are potentially correlated with your response variable, data mining can help you identify candidates. However, there are problems associated with using data mining to select variables.
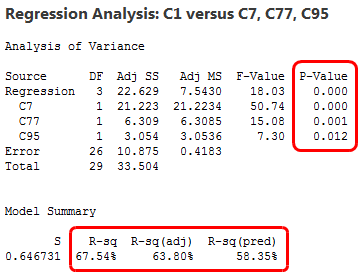
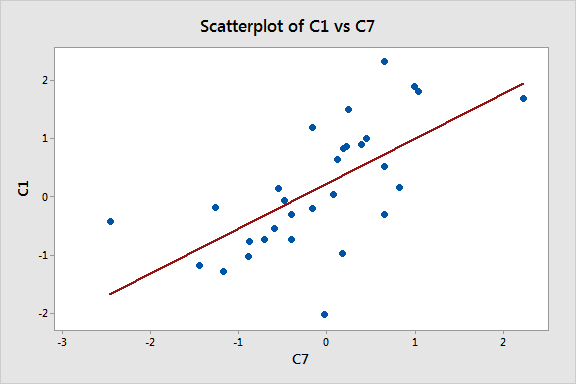
In my previous post, we used data mining to settle on the following model and graphed one of the relationships between the response (C1) and a predictor (C7). It all looks great! The only problem is that all of these data are randomly generated! No true relationships are present.


If you didn't already know there was no true relationship between these variables, these results could lead you to a very inaccurate conclusion.
Let's explore how these problems happen, and how to avoid them
Why Do These Problems Occur with Data Mining?
The problem with data mining is that you fit many different models, trying lots of different variables, and you pick your final model based mainly on statistical significance, rather than being guided by theory.
What's wrong with that approach? The problem is that every statistical test you perform has a chance of a false positive. A false positive in this context means that the p-value is statistically significant but there really is no relationship between the variables at the population level. If you set the significance level at 0.05, you can expect that in 5% of the cases where the null hypothesis is true, you'll have a false positive.
Because of this false positive rate, if you analyze many different models with many different variables you will inevitably find false positives. And if you're guided mainly by statistical significance, you'll leave the false positives in your model. If you keep going with this approach, you'll fill your model with these false positives. That’s exactly what happened in our example. We had 100 candidate predictor variables and the stepwise procedure literally dredged through hundreds and hundreds of potential models to arrive at our final model.
As we’ve seen, data mining problems can be hard to detect. The numeric results and graph all look great. However, these results don’t represent true relationships but instead are chance correlations that are bound to occur with enough opportunities.
If I had to name my favorite R-squared, it would be predicted R-squared, without a doubt. However, even predicted R-squared can't detect all problems. Ultimately, even though the predicted R-squared is moderate for our model, the ability of this model to predict accurately for an entirely new data set is practically zero.
Theory, the Alternative to Data Mining
Data mining can have a role in the exploratory stages of an analysis. However, for all variables that you identify through data mining, you should perform a confirmation study using newly collected to data to verify the relationships in the new sample. Failure to do so can be very costly. Just imagine if we had made decisions based on the model above!
An alternative to data mining is to use theory as a guide in terms of both the models you fit and the evaluation of your results. Look at what others have done and incorporate those findings when building your model. Before beginning the regression analysis, develop an idea of what the important variables are, along with their expected relationships, coefficient signs, and effect magnitudes.
Building on the results of others makes it easier both to collect the correct data and to specify the best regression model without the need for data mining. The difference is the process by which you fit and evaluate the models. When you’re guided by theory, you reduce the number of models you fit and you assess properties beyond just statistical significance.
Theoretical considerations should not be discarded based solely on statistical measures.
- Compare the coefficient signs to theory. If any of the signs contradict theory, investigate and either change your model or explain the inconsistency.
- Use Minitab statistical software to create factorial plots based on your model to see if all the effects match theory.
- Compare the R-squared for your study to those of similar studies. If your R-squared is very different than those in similar studies, it's a sign that your model may have a problem.
If you’re interested in learning more about these issues, read my post about how using too many phantom degrees of freedom is related to data mining problems.


