


Previously, I’ve written about how to interpret regression coefficients and their individual P values.
I’ve also written about how to interpret R-squared to assess the strength of the relationship between your model and the response variable.
Recently I've been asked, how does the F-test of the overall significance and its P value fit in with these other statistics? That’s the topic of this post!
In general, an F-test in regression compares the fits of different linear models. Unlike t-tests that can assess only one regression coefficient at a time, the F-test can assess multiple coefficients simultaneously.
The F-test of the overall significance is a specific form of the F-test. It compares a model with no predictors to the model that you specify. A regression model that contains no predictors is also known as an intercept-only model.
The hypotheses for the F-test of the overall significance are as follows:
- Null hypothesis: The fit of the intercept-only model and your model are equal.
- Alternative hypothesis: The fit of the intercept-only model is significantly reduced compared to your model.
In Minitab statistical software, you'll find the F-test for overall significance in the Analysis of Variance table.
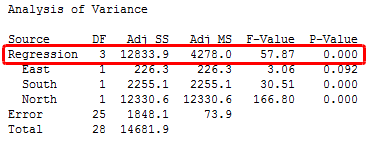
If the P value for the F-test of overall significance test is less than your significance level, you can reject the null-hypothesis and conclude that your model provides a better fit than the intercept-only model.
Great! That set of terms you included in your model improved the fit!
Typically, if you don't have any significant P values for the individual coefficients in your model, the overall F-test won't be significant either. However, in a few cases, the tests could yield different results. For example, a significant overall F-test could determine that the coefficients are jointly not all equal to zero while the tests for individual coefficients could determine that all of them are individually equal to zero.
There are a couple of additional conclusions you can draw from a significant overall F-test.
In the intercept-only model, all of the fitted values equal the mean of the response variable. Therefore, if the P value of the overall F-test is significant, your regression model predicts the response variable better than the mean of the response.
While R-squared provides an estimate of the strength of the relationship between your model and the response variable, it does not provide a formal hypothesis test for this relationship. The overall F-test determines whether this relationship is statistically significant. If the P value for the overall F-test is less than your significance level, you can conclude that the R-squared value is significantly different from zero.
To see how the F-test works using concepts and graphs, see my post about understanding the F-test.
If your entire model is statistically significant, that's great news! However, be sure to check the residual plots so you can trust the results!
If you're learning about regression, read my regression tutorial!