In my last post, I detailed a study where the regression analysis seemed to show that higher calcium intake was associated with reduced injuries among our subjects. I had taken the data we collected for our main study and tried to use it to see if there were patterns amongst those who experienced the knee pain.
A post hoc analysis like this can often give you good results but it can lead you astray. In this case, I don’t really think calcium was protecting the knees of our subjects. Rather, I suspect that a confounding variable, or two, were involved.
Like a detective looking for clues to solve a mystery, we’ll try to uncover some possible culprits. We’ll focus on identifying confounding variables whose omission from the regression model may have made calcium intake appear to be significant when it probably is insignificant. To do this, we’ll need to identify a correlation structure that would produce this deceptive result.
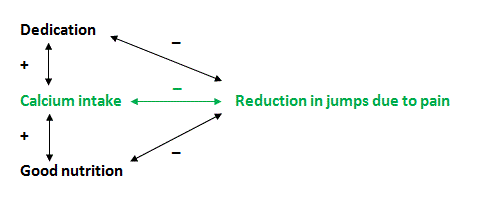
The diagram below illustrates my educated guess about such a correlation structure. The green indicates the negative correlation that we observed. In black are 2 hypothesized confounding variables, Dedication and Good nutrition. Let’s take a look at these hypothetical variables and see how the correlations work.

Overall Dedication
Dedication is a personality trait that may be correlated with many aspects of the subject’s life, including both the dedication to completely filling out her diet record and her dedication in completing the exercise intervention.
The 3-day diet records were administered several times a year. The subjects were to record everything that they ate. Self-reporting is always suspect, and my guess is that some of the subjects were less dedicated to recording everything. If they didn’t record everything, their calcium intake would appear to be lower than it actually was. Therefore, higher dedication would lead to a higher apparent calcium intake, which produces the positive correlation in the diagram.
The jumping intervention was administered in PE class. The teacher indicated that some of her students were less dedicated and that she had to push some to keep them going. We didn’t feel it was ethical for her to push our exercise intervention as hard as she pushed her own curriculum. Therefore, lower dedication would lead to a higher reduction in jumps, a negative correlation.
The combined result of this correlation pattern is that a subject with low overall dedication will appear to have a lower calcium intake and she may find ways to increase her reduction of jumps. And, for those with higher dedication: higher calcium intake and lower reduction in jumps. This would create the observed negative correlation between calcium intake and the reduction in jumps.
Good Nutrition
Good general nutrition may play a role in both calcium intake and reduced jumps. While we only calculated and recorded their calcium intake, it’s not hard to guess that those subjects with higher calcium intake may well have better overall nutrition, a positive correlation.
Further, it’s possible that subjects with good nutrition could have better strength, health and/or healing capabilities that lead to a lower reduction in jumps, a negative correlation.
The combined result is an apparent negative correlation between calcium intake and the reduction in jumps. Good nutrition produces higher calcium intake and lower reductions in jumps.
Conclusion
These are educated guesses. They’re based on first-hand knowledge of the study but there is no way to know for sure. However, if Dedication and/or Good nutrition are confounding variables, they would explain the reduction in jumps, not calcium intake.
So, let’s assume that these 2 variables are true confounding variables as depicted in the diagram and let’s further assume that calcium was not protecting our subjects’ knees. What would’ve happened if we had good measures for Dedication and Good nutrition and had added them to the regression analysis, after calcium intake, as predictors for reduction in jumps? We would expect that both Dedication and Good nutrition would have significant, negative coefficients in the regression model. We would further expect that Calcium intake would lose its significance.
The statistical lessons learned from this study?
- Omitting confounding variables can mess up your statistical analysis.
- Measure everything that is important.
- Ad hoc data analysis is convenient, but using existing data for other purposes presents its own hazards.
For this study, we just wanted to see if we could find a quick answer about the injuries. We couldn’t, but it was a worthwhile attempt. In my next post, I’ll show how you can use random assignment in experiments to protect yourself from confounding variables.


