This tutorial covers many aspects of regression analysis including: choosing the type of regression analysis to use, specifying the model, interpreting the results, determining how well the model fits, making predictions, and checking the assumptions. At the end, I include examples of different types of regression analyses.
Why Choose Regression and the Hallmarks of a Good Regression Analysis
Before we begin the regression analysis tutorial, there are several important questions to answer.
Why should we choose regression at all? What are the common mistakes that even experts make when it comes to regression analysis? And, how do you distinguish a good regression analysis from a less rigorous regression analysis? Read these posts to find out:
- Tribute to Regression Analysis: See why regression is my favorite! Sure, regression generates an equation that describes the relationship between one or more predictor variables and the response variable. But, there’s much more to it than just that.
- Four Tips on How to Perform a Regression Analysis that Avoids Common Problems: Keep these tips in mind through out all stages of this tutorial to ensure a top-quality regression analysis.
- Sample Size Guidelines: These guidelines help ensure that you have sufficient power to detect a relationship and provide a reasonably precise estimate of the strength of that relationship.
Tutorial: How to Choose the Correct Type of Regression Analysis
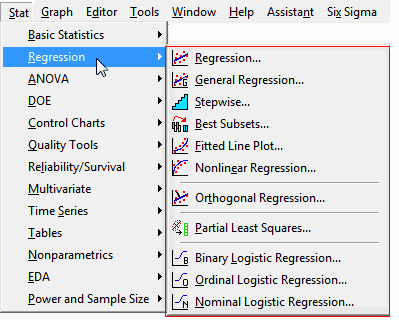
 Minitab statistical software provides a number of different types of regression analysis. Choosing the correct type depends on the characteristics of your data, as the following posts explain.
- Giving Thanks for the Regression Menu: regression choices using a yummy Thanksgiving context!
- Linear or Nonlinear Regression: How to determine when you should use one or the other.
- What is the Difference between Linear and Nonlinear Equations: Both types of equations can model curvature, so what is the difference between them?
Tutorial: How to Specify Your Regression Model
 Choosing the correct type of regression analysis is just the first step in this regression tutorial. Next, you need to specify the model. Model specification consists of determining which predictor variables to include in the model and whether you need to model curvature and interactions between predictor variables.
Specifying a regression model is an iterative process. The interpretation and assumption verification sections of this regression tutorial show you how to confirm that you’ve specified the model correctly and how to adjust your model based on the results.
- How to Choose the Best Regression Model: some common statistical methods, complications you may face, and provide some practical advice.
- Stepwise and Best Subsets Regression: Minitab provides two automatic tools that help identify useful predictors during the exploratory stages of model building.
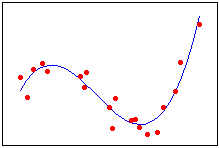
- Curve Fitting with Linear and Nonlinear Regression: Sometimes your data just don’t follow a straight line and you need to fit a curved relationship.
- Interaction effects: interactions using Ketchup and Soy Sauce.
- Overfitting the model: Overly complex models can produce misleading results. Learn about overfit models and how to detect and avoid them.
- Hierarchical models: I review reasons to fit, or not fit, a hierarchical model. A hierarchical model contains all lower-order terms that comprise the higher-order terms that also appear in the model.
- Standardizing the variables: In certain cases, standardizing the variables in your regression model can reveal statistically significant findings that you might otherwise miss.
- Five reasons why your R-squared can be too high: If you specify the wrong regression model, or use the wrong model fitting process, the R-squared can be too high.
Tutorial: How to Interpret your Regression Results
So, you’ve chosen the correct type of regression and specified the model. Now, you want to interpret the results. The following topics in the regression tutorial show you how to interpret the results and effectively present them:
- Regression coefficients and p-values
- Regression Constant (Y intercept)
- How to statistically test the difference between regression slopes and constants
- R-squared and the goodness-of-fit
- How high should R-squared be?
- How to interpret a model with a low R-squared
- Adjusted R-squared and Predicted R-squared
- S, the standard error of the regression
- F-test of overall significance
- How to Compare Regression Slopes
- Present Your Regression Results to Avoid Costly Mistakes: Research shows that presentation affects the number of interpretation mistakes.
- Identify the Most Important Predictor Variables: After you've settled on a model, it’s common to ask, “Which variable is most important?”
Tutorial: How to Use Regression to Make Predictions
 In addition to determining how the response variable changes when you change the values of the predictor variables, the other key benefit of regression is the ability to make predictions. In this part of the regression tutorial, I cover how to do just this.
- How to Predict with Minitab: A prediction guide that uses BMI to predict body fat percentage.
- Predicted R-squared: This statistic indicates how well a regression model predicts responses for new observations rather than just the original data set.
- Prediction intervals: See how presenting prediction intervals is better than presenting only the regression equation and predicted values.
- Prediction intervals versus other intervals: I compare prediction intervals to confidence and tolerance intervals so you’ll know when to use each type of interval.
Tutorial: How to Check the Regression Assumptions and Fix Problems
 Like any statistical test, regression analysis has assumptions that you should satisfy, or the results can be invalid. In regression analysis, the main way to check the assumptions is to assess the residual plots. The following posts in the tutorial show you how to do this and offer suggestions for how to fix problems.
- Residual plots: What they should look like and reasons why they might not!
- How important are normal residuals: If you have a large enough sample, nonnormal residuals may not be a problem.
- Multicollinearity: Highly correlated predictors can be a problem, but not always!
- Heteroscedasticity: You want the residuals to have a constant variance (homoscedasticity), but what if they don’t?
- Box-Cox transformation: If you can’t resolve the underlying problem, Cody Steele shows how easy it can be to transform the problem away!
Examples of Different Types of Regression Analyses
The final part of the regression tutorial contains examples of the different types of regression analysis that Minitab can perform. Many of these regression examples include the data sets so you can try it yourself!
- Linear Model Features in Minitab
- Multiple regression with response optimization: Highlights features in the Minitab Assistant.
- Orthogonal regression: how orthogonal regression (a.k.a. Deming Regression) can test the equivalence of different instruments.
- Partial least squares (PLS) regression: using PLS to successfully analyze a very small and highly multicollinear data set.


