


Choosing the right type of subgroup in a control chart is crucial. In a rational subgroup, the variability within a subgroup should encompass common causes, random, short-term variability and represent “normal,” “typical,” natural process variations, whereas differences between subgroups are useful to detect drifts in variability over time (due to “special” or “assignable” causes). Variation within subgroup is therefore used to estimate the natural process standard deviation and to calculate the 3-sigma control chart limits.
In some cases, however, identifying the correct rational subgroup is not easy. For example, when parts are manufactured in batches, as they are in the automotive or in the semiconductor industries.
Batches of parts might seem to represent ideal subgroups, or at least a self-evident way to organize subgroups, for Statistical Process Control (SPC) monitoring. However, this is not always the right approach. When batches aren't a good choice for rational subgroups, control chart limits may become too narrow or too wide.
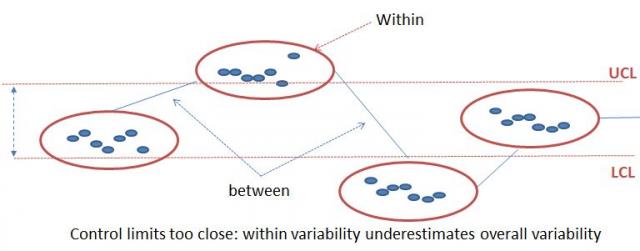
Control Limits May Be Too Narrow
Since batches are often manufactured at the same time on the same equipment, the variability within batches is often much smaller than the overall variability. In this case, the within-subgroup variability is not really representative and underestimates the natural process variability. Since within-subgroups variability is used to calculate the control chart limits, these limits may become unrealistically close to one another, which ultimately generates a large number of false alarms.
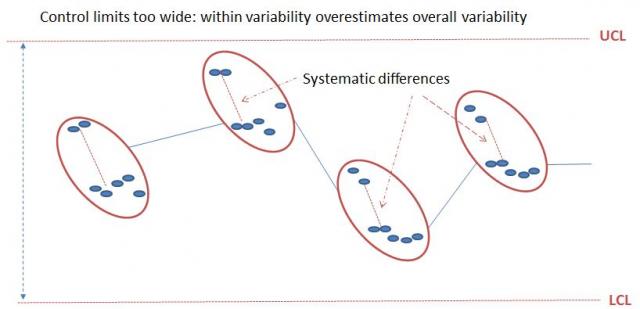
Control Limits May Be Too Wide
On the other hand, suppose that within batches a systematic difference exists between the first two parts and the rest of the batch. In this case, the within-batch variability will include this systematic difference, which will inflate the within-subgroups standard deviation. Note that the between-subgroup variability is not affected by this systematic difference, and remember that only the within-subgroup variance is used to estimate the SPC limits. In this situation, the distance between the control limits would become too wide, would not allow you to quickly identify drifts.
For example, in an injection mold with several cavities, when groups of parts molded at the same time but in different cavities are used as subgroups, systematic differences between cavities on the same mold will necessarily impact and inflate the within-subgroup variability.
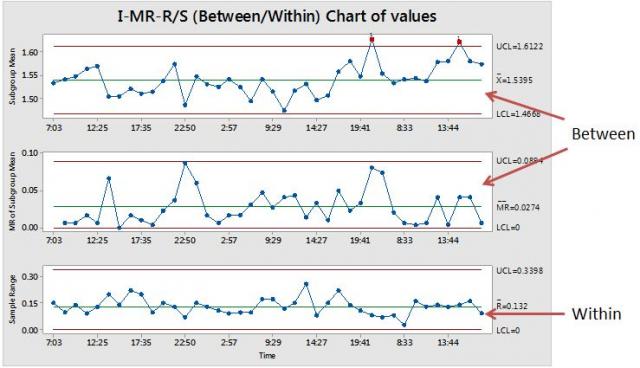
I-MR-R/S Between/Within charts
When we encounter these situations in practice, using SPC charts can become more difficult and less efficient. An obvious solution is to consider within- and between-subgroup sources of variability separately. In Minitab, if you go to Stat > Control Charts > Variables Charts for Subgroups..., you will find I-MR-R/S Between/Within Charts to cover these types of issues.
Between/within charts are commonly used in the semiconductor industry, for example. Wafers are manufactured in batches (usually 25 wafers in a batch), and these batches are treated as subgroups in practice.
Using I-MR-R/S (between / within) charts allows you to use the I-MR chart to monitor differences between subgroups (I-MR charts), but in addition it also allows you to control within-subgroup variations (the R/S chart). Thus, this chart provides a full and coherent picture of the overall process variability. Thanks to that, identifying the right rational subgrouping scheme is not as crucial as it is when using standard Xbar-R or S control charts
Conclusion
We've all encountered ideas that seem simple in theory, but reality is often more complex than we expect. I-MR-R/S Between/Within control charts are a very flexible and efficient tool that make it much easier to account for complexities in process variability. They enable you to monitor Within and Between sources of variability separately.
If selecting the right rational subgroups is a challenge when you use control charts, this approach can minimize the number of false alarms you experience, while permitting you to react as quickly as possible to true “special” causes.