


To make objective decisions about the processes that are critical to your organization, you often need to examine categorical data. You may know how to use a t-test or ANOVA when you’re comparing measurement data (like weight, length, revenue, and so on), but do you know how to compare attribute or counts data? It easy to do with statistical software like Minitab.
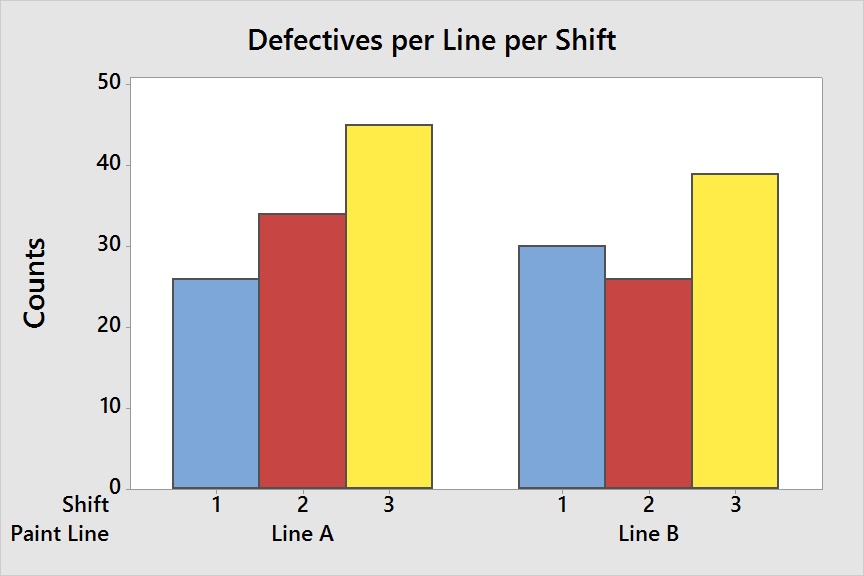
One person may look at this bar chart and decide that the production lines performed similarly. But another person may focus on the small difference between the bars and decide that one of the lines has outperformed the others. Without an appropriate statistical analysis, how can you know which person is right?
When time, money, and quality depend on your answers, you can’t rely on subjective visual assessments alone. To answer questions like these with statistical objectivity, you can use a Chi-Square analysis.
Which Analysis Is Right for Me?
Minitab offers three Chi-Square tests. The appropriate analysis depends on the number of variables that you want to examine. And for all three options, the data can be formatted either as raw data or summarized counts.
Chi-Square Goodness-of-Fit Test – 1 Variable
Use Minitab’s Stat > Tables > Chi-Square Goodness-of-Fit Test (One Variable) when you have just one variable.
The Chi-Square Goodness-of-Fit Test can test if the proportions for all groups are equal. It can also be used to test if the proportions for groups are equal to specific values. For example:
- A bottle cap manufacturer operates three production lines and records the number of defective caps for each line. The manufacturer uses the Chi-Square Goodness-of-Fit Test to determine if the proportion of defectives is equal across all three lines.
- A bottle cap manufacturer operates three production lines and records the number of defective caps and the total number produced for each line. One line runs at high speed and produces twice as many caps as the other two lines that run at a slower speed. The manufacturer uses the Chi-Square Goodness-of-Fit Test to determine if the number of defective units for each line is proportional to the volume of caps it produces.
Chi-Square Test for Association – 2 Variables
Use Minitab’s Stat > Tables > Chi-Square Test for Association when you have two variables.
The Chi-Square Test for Association can tell you if there’s an association between two variables. In another words, it can test if two variables are independent or not. For example:
- A paint manufacturer operates two production lines across three shifts and records the number of defective units per line per shift. The manufacturer uses the Chi-Square Goodness-of-Fit Test to determine if the percent defective is similar across all shifts and production lines. Or, are certain lines during certain shifts more prone to issues?
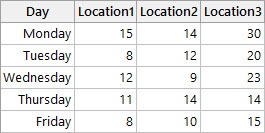
- A call center randomly samples 100 incoming calls each day of the week for each of its three locations, for a total of 1500 calls. They then record the number of abandoned calls per location per day. The call center uses a Chi-Square Test to determine if there are is any association between location and day of the week with respect to missed calls.
Cross Tabulation and Chi-Square – 2 or more variables
Use Minitab’s Stat > Tables > Cross Tabulation and Chi-Square when you have two or more variables.
If you simply want to test for associations between two variables, you can use either Cross Tabulation and Chi-Square or Chi-Square Test for Association. However, Cross Tabulation and Chi-Square also lets you control for the effect of additional variables. Here’s an example:
- A tire manufacturer records the number of failed tires for four different tire sizes across two production lines and three shifts. The plant uses a Cross Tabulation and Chi-Square analysis to look for failure dependencies between the tire sizes and production lines, while controlling for any shift effect. Perhaps a particular production line for a certain tire size is more prone to failures, but only during the first shift.
This analysis also offers advanced options. For example, if your categories are ordinal (good, better, best or small, medium, large) you can include a special test for concordance.
Conducting a Chi-Square Analysis in Minitab
Each of these analyses is easy to run in Minitab. For more examples that include step-by-step instructions, just navigate to the Chi-Square menu of your choice and then click Help > example.
It can be tempting to make subjective assessments about a given set of data, their makeup, and possible interdependencies, but why risk an error in judgment when you can be sure with a Chi-Square test?
Whether you’re interested in one variable, two variables, or more, a Chi-Square analysis can help you make a clear, statistically sound assessment.