


As a member of Minitab’s Consulting and Custom Development Services team, I get to help companies across a variety of industries create many different types of reports for management. These reports often need to be generated weekly or monthly. I prefer to automate tasks like this whenever possible, so that new or updated reports can be created without much effort. A little investment up front can save a lot of time by eliminating the need to recreate the wheel every time management wants a current report.
I’m going to tell you how to use Minitab Statistical Software to automatically generate a report based on information retrieved from an external data source. But there’s a lot to cover, so I’ll have to do it in two posts.
In this post, I’ll discuss automating analyses inside Minitab. In the next post I’ll demonstrate how to get Minitab “talking” to Microsoft Word programmatically using Minitab’s API. The end result will be a very simple automated report that exhibits the power of customization in Minitab.
Requirements for a Capability Report
 We’re going to create a simple Capability report based on some commonly used tools in the quality realm. Let’s start by breaking down what we need to make it:
- First, we need data! We can automatically pull in the current month’s data from an Access database. I created my own Table in Access for this example, which you can download here.
- Next, we need to analyze the data. We’ll run three analyses and store the following results:
- Normality Test → Store the P-Value associated with the Test.
- Control Chart → Store how many data points are out of control.
- Process Capability → Store the Cpk statistic.
Generating the Minitab Code
Now that we have our strategy for Minitab, let’s pull the data into Minitab programmatically. Here is the Minitab Command Language we’ll use to import the data:
ODBC;
 Connect "DSN=MS Access Database;DBQ=C:blogpost.accdb";
 SQLString "SELECT Date,Yield FROM Yield where MONTH(Date)=Month(NOW())" &
 "and YEAR(Date)=YEAR(NOW())".
This may look like another language to you, and it sort of is. So let’s break down what it says. The section below is a Connection String that tells Minitab where your database is, and how to connect to it:
Connect "DSN=MS Access Database;DBQ=C:blogpost.accdb";
(If you’re following along, you’ll need to alter the database location C:blogpost.accdb to reflect the location of the file on your machine.)
The next section is just an SQL Statement in command language:
SQLString "SELECT Date, Yield FROM Yield WHERE MONTH(Date)=Month(NOW())" &
 "and YEAR(Date)=YEAR(NOW())".
If you look closely at the SELECT statement, you will notice we are pulling two fields (Date and Yield) from a Database table named Yield. We also include this condition:
WHERE MONTH(Date)=Month(NOW()) and YEAR(Date)=YEAR(NOW()).
Can you guess what the condition is doing? If you guessed that it pulls data corresponding to the current month, you are correct. Of course, SQL statements can be much more complicated that this example. Fortunately, Minitab lets you use the SQL statement that best fits your needs, no matter how complex it may be.
Now that we’ve pulled the data in using Minitab Command Language, we need Minitab to run a few tests and create some charts.
To run the Normality test on Yield and store the p-value in column 3, the command language is:
Normtest Yield;
 Spvalue C3.
Pretty straightforward. Now let’s run the I-Chart and count how many points are out of control:
IChart Yield;
   Stamp Date; # this command puts the Date on the X-axis of the chart
   TResults C4.
Sum C4 K1
The constant K1 will now reflect how many points were out of control.
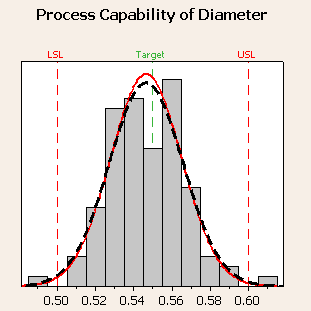
For this Capability Analysis, we will assume the data is Normal and that the Yield of the product has a Lower Spec of 7 and an Upper Spec of 13. We will store Cpk in column 5:
Capa Yield 1; # the number 1 signifies the subgroup size
   Lspec 7;
   Uspec 13;
   CPK C5.
There you have it! We just imported the current month’s data and ran three analyses with the following command language:
ODBC;
   Connect "DSN=MS Access Database;DBQ=C:blogpost.accdb";
   SQLString "SELECT Date,Yield FROM Yield where MONTH(Date)=Month(NOW())" &
   "and YEAR(Date)=YEAR(NOW())".
Normtest Yield;
   Spvalue C3.
IChart Yield;
   Stamp Date; # this command puts the Date on the X-axis of the chart
   TResults C4.
Sum C4 K1
Capa Yield 1; # the number 1 signifies the subgroup size
   Lspec 7;
   Uspec 13;
   CPK C5.
If you save the above command language in Notepad using the file extension .mtb, you will have a Minitab Exec. You can run this file in Minitab by navigating to File > Other Files > Run an Exec.
In the next blog post, I will describe how to utilize Minitab’s API in Visual Basic for Applications to generate the Capability Report.