


Now that you’ve seen how to automatically import data and run analyses in my previous post, let’s create the Monthly Report!
I will be using a Microsoft Word Document (Office 2010) and adding bookmarks to act as placeholders for the Graphs, statistics, and boilerplate conclusions.
Let’s go through the steps to accomplish this:
- Open up an existing report that you have previously created in Microsoft Word.
- Highlight a section of the document where you would like to place the created Minitab graph or statistic.
- Go to the Insert tab, click the Bookmark link, and type in the name of what you will be replacing. In this instance, I typed ‘NormalityPlot’ and clicked Add:
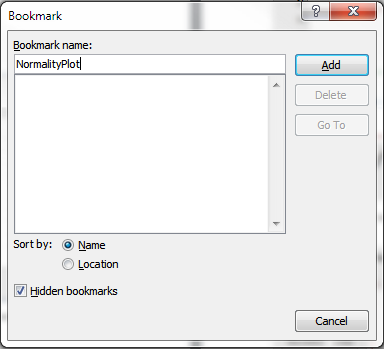
- Repeat the steps above for each graph and statistic that will need to be inserted into your report.
Now go to the Developer tab in Microsoft Word, and click on Macros. Here you can enter the name of your macro and click Create.
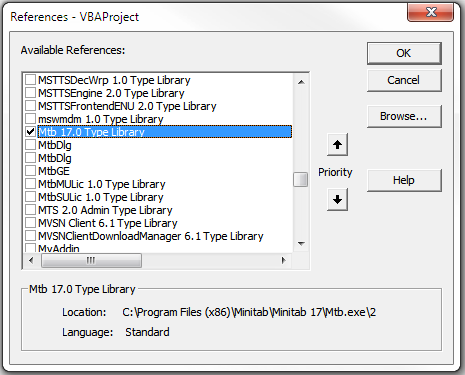
Let’s first make sure we reference the Minitab COM API, so Microsoft Word can talk directly to Minitab. In Visual Basic for Applications, go to Tools > References, and check the box for ‘Mtb 17.0 Type Library’.
We can now start coding. Let’s start by declaring some variables and initializing them:
Dim mtbApp As Mtb.Application
 Dim mtbProject As Mtb.Project
 Dim mtbWorksheet As Mtb.Worksheet
Set mtbApp = New Mtb.Application
 Set mtbProject = mtbApp.ActiveProject
 Set mtbWorksheet = mtbProject.ActiveWorksheet
' We can even have Minitab run behind the scenes, hidden from the user.
 mtbApp.UserInterface.Visible = False
 mtbApp.UserInterface.DisplayAlerts = False
The code above gets Minitab running. Next let’s run the Minitab exec we created in the last blog post:
mtbProject.ExecuteCommand "Execute 'C:UsersdgriffithDesktopblog.mtb' 1."
(If you’re following along, you’ll need to alter the exec location C:USERSDGRIFFITHDESKTOPblog.mtb to reflect the location of the file on your machine.)
Now we can tell Minitab to save the graphs as JPEGs and place them in the Report. Once again, you’ll need to change the file locations to match yours.
mtbProject.Commands.Item(3).Outputs.Item(1).Graph.SaveAs "C:normtest", True, GFJPEG
ActiveDocument.Bookmarks("NormalityPlot").Range.InlineShapes.AddPicture "C:normtest.jpg"
mtbProject.Commands.Item(4).Outputs.Item(1).Graph.SaveAs "C:controlchart", True, GFJPEG
ActiveDocument.Bookmarks("ControlChart").Range.InlineShapes.AddPicture "C:controlchart.jpg"
mtbProject.Commands.Item(6).Outputs.Item(1).Graph.SaveAs "C:capability", True, GFJPEG
ActiveDocument.Bookmarks("Capability").Range.InlineShapes.AddPicture "C:capability.jpg"
At this point, we have placed all the graphs successfully into the report. Let’s add some boilerplate text around the Normality test P-Value, the number of data points that are out of control, and whether or not Cpk meets our guideline of 1.33:
Dim pValue As Double
pValue = mtbWorksheet.Columns.Item(3).GetData(1, 1)
If pValue <= 0.05 Then
ActiveDocument.Bookmarks("Pvalue").Range.Text = "Data does not pass Normality Test"
Else
ActiveDocument.Bookmarks("Pvalue").Range.Text = "Since Normality Test P-Value is greater than 0.05. Assume Normal Distribution"
End If
Dim oocPoints As Integer
oocPoints = mtbWorksheet.Constants.Item(1).GetData
If oocPoints = 0 Then
ActiveDocument.Bookmarks("OutOfControl").Range.Text = "Data appears to be stable over time"
ElseIf oocPoints = 1 Then
ActiveDocument.Bookmarks("OutOfControl").Range.Text = "Investigation is needed as 1 data point was found to be out of control."
Else
ActiveDocument.Bookmarks("OutOfControl").Range.Text = "Investigation is needed as " & oocPoints & " data points were found to be out of control."
End If
Dim cpk As Double
cpk = mtbWorksheet.Columns.Item(5).GetData(1, 1)
If cpk < 1.33 Then
ActiveDocument.Bookmarks("cpk").Range.Text = "Cpk does not pass Acceptable Guideline of 1.33."
Else
ActiveDocument.Bookmarks("cpk").Range.Text = "Cpk passes Acceptable Guideline of 1.33. Process is operating at Acceptable level."
End If
So what does all this get us? The code above generates the following report:
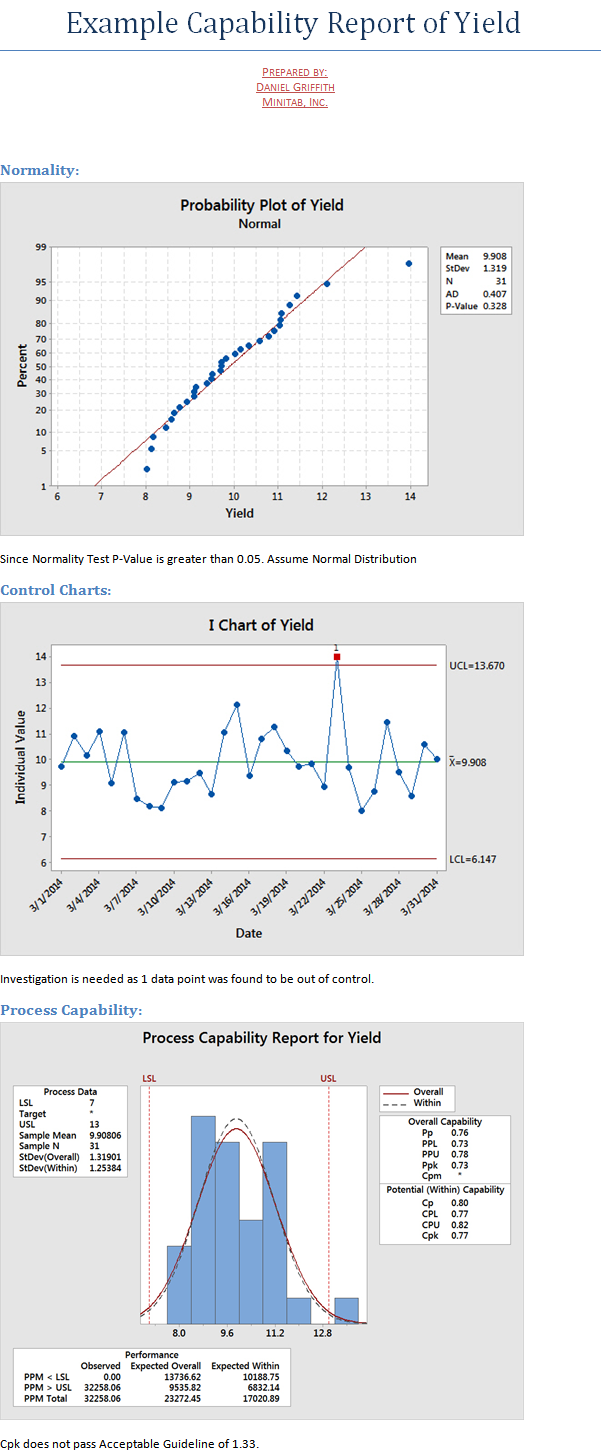
Running the Microsoft Word macro automatically generates a report that communicates with Minitab Statistical Software (in the background) and provides an understanding of our process for the current month. And now that the code is written, you have a fully functioning Report generation tool that works with the press of a button.
Pretty neat, if you ask me.
If you are intimidated by this type of process, we provide a service that does the programming for you. More information can be found here. You can also e-mail us, and I will personally follow up to see if we can automate any processes for you. Also, if you would like to see additional examples illustrated in a blog post, feel free to post a comment below.
If you want to get your hands dirty in the programming, you can find more information in Minitab’s Help System:
For Minitab Command Language, go to Help > Help and click the link for Session Commands.
For Minitab’s API, go to Help > Help and click the link for Minitab Automation.