Users often contact Minitab technical support to ask how the software calculates the control limits on control charts.
A frequently asked question is how the control limits are calculated on an I-MR Chart or Individuals Chart. If Minitab plots the upper and lower control limits (UCL and LCL) three standard deviations above and below the mean, why are the limits plotted at values other than 3 times the standard deviation that I get using Stat > Basic Statistics?
That’s a valid question—if we’re plotting individual points on the I-Chart, it doesn’t seem unreasonable to try to calculate a simple standard deviation of the data points, multiply by 3 and expect the UCL and LCL to be the data mean plus or minus 3 standard deviations. This can be especially confusing because the Mean line on the Individuals chart IS the mean of the data!
However, the standard deviation that Minitab Statistical Software uses is not the simple standard deviation of the data. The default method that Minitab uses (and an option to change the method) is available by clicking the I-MR Options button, and then choosing the Estimate tab:
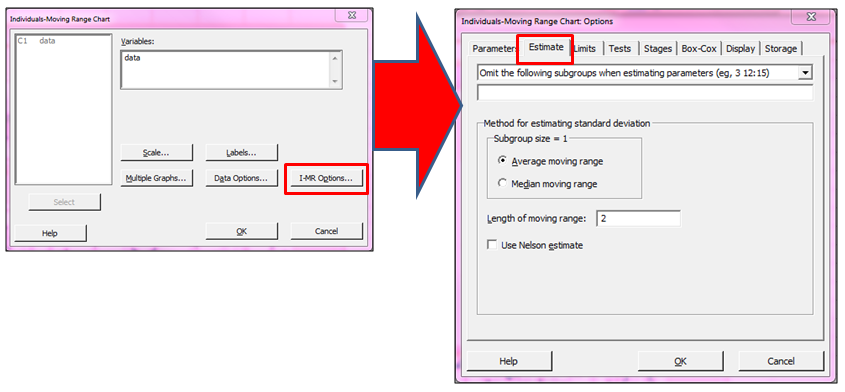
There we can see that Minitab is using the Average moving range method with 2 as the length of moving range to estimate the standard deviation.
That’s all well and good, but exactly what the heck is an average moving range with length 2?!
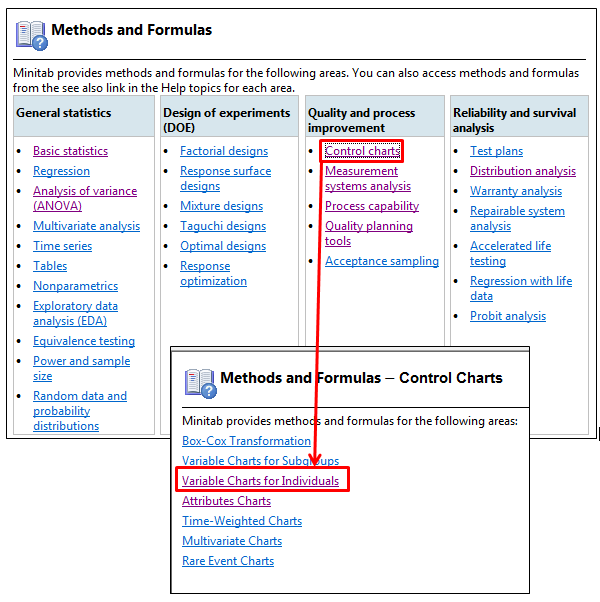
Minitab’s Methods and Formulas section details the formulas used for these calculations. In fact, Methods and formulas provides information on formulas used for all the calculations available through the dialog boxes: This information can be accessed via the Help menu, by choosing Help > Methods and Formulas...
Too see the formulas for control chart calculations, we choose Control Charts > Variables Charts for Individuals as shown below:
The next page shows the formulas organized by topic. By selecting the link Methods for estimating standard deviation we find the formula for the Average moving range:
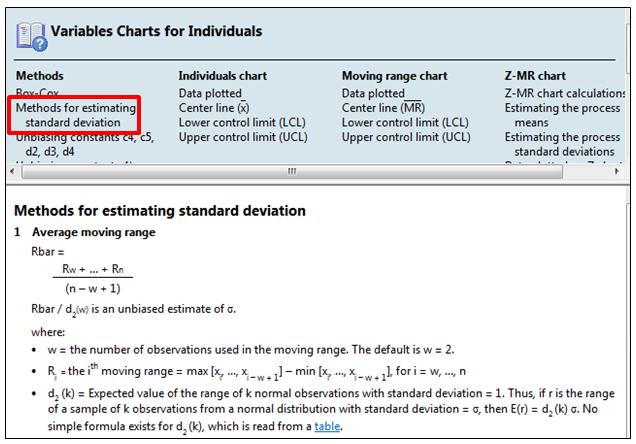
Looking at the formula, things become a bit clearer—the ‘length of the moving range’ is the number of data points used when we calculate the moving range (i.e., the difference from point 1 to point 2, 2 to 3, and so forth).
If we want to hand-calculate the control limits for a dataset, we can do that with a little help from Minitab!
The dataset I’ve used for this example is available HERE.
First, we’ll need to get the values of the moving ranges. We’ll use the calculator by navigating to Calc > Calculator; in the example below, we’re storing the results in column C2 (an empty column) and we’re using the LAG function in the calculator. That will move each of our values in column C1 down by 1 row. Click OK to store the results in the worksheet.
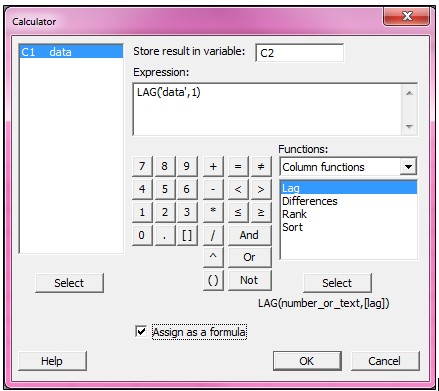
Note: By choosing the Assign as a formula option at the bottom of the calculator, we can add a formula to column C2 which we can easily go back and edit if a mistake was made.
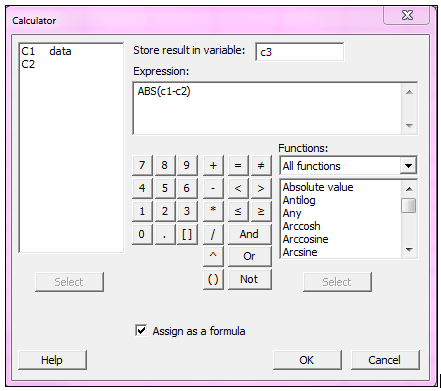
Now with the lags stored in C2, we use the calculator again: Calc > Calculator (here's a tip: press F3 on the keyboard to clear out the previous calculator entry), then subtract column C2 from column C1 as shown below, storing the results in C3. We use the ABS calculator command to get the absolute differences of each row:
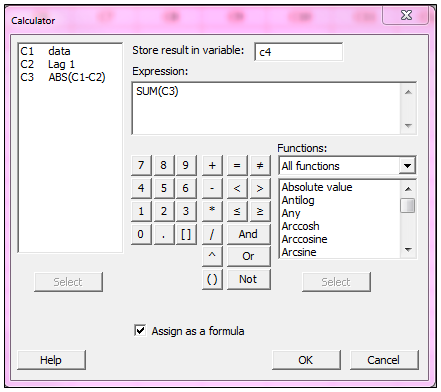
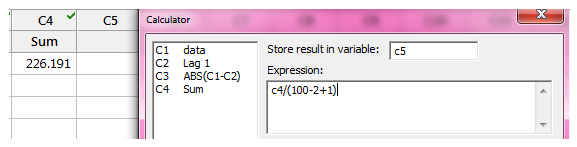
Next we calculate the sum of the absolute value of the moving ranges by using Calc > Calculator once again. We’ll store the sum in the next empty column, C4:
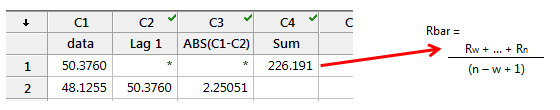
The value of this sum represents the numerator in the Rbar calculation:
To complete the Rbar calculation, we use the information from Methods and Formulas to come up with the denominator; n is the number of data points (in this example it’s 100), w’s default value is 2 ,and we add 1, so the denominator is 100-2+1. In Minitab, we can once again use Calc > Calculator to store the results in C5:
With Rbar calculated, we find the value of the unbiasing constant d2 from the table that is linked in Methods and Formulas:
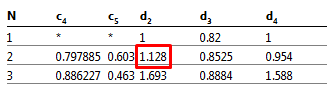
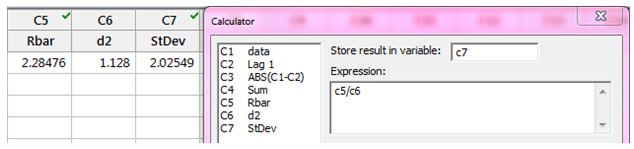
For a moving-range of length 2, the d2 value is 1.128, so we enter 1.128 in the first row in column C6, and use the calculator one more time to divide Rbar by d2 to get the standard deviation, which works out to be 2.02549:
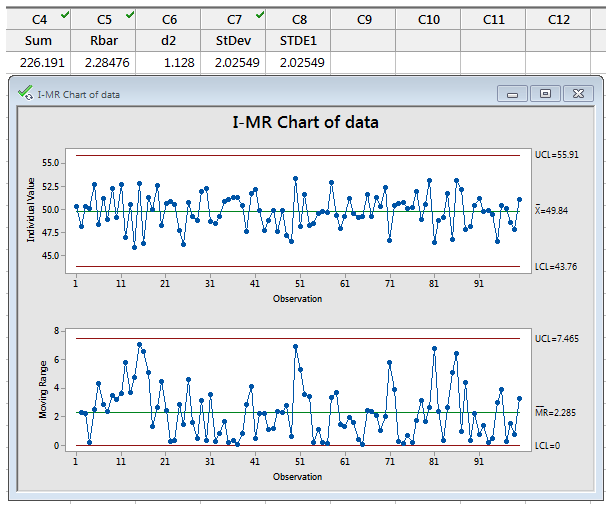
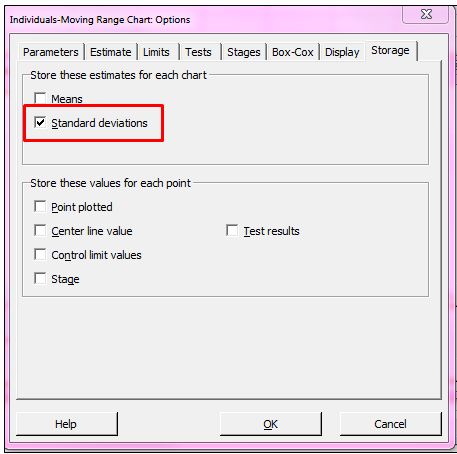
We can check our results by using the original data to create an I-MR chart. We enter the data column in Variables, and then click I-MR Options and choose the Storage tab; here we can tell Minitab to store the standard deviation in the worksheet when we create the chart:
The stored standard deviation is shown in the new column titled STDE1, and it matched the value we hand-calculated. Notice also that the Rbar we calculated is the average of the moving ranges on the Moving-Range chart. Beautiful!