


We often receive questions about moving ranges because they're used in various tools in our statistical software, including control charts and capability analysis when data is not collected in subgroups. In this post, I'll explain what a moving range is, and how a moving range and average moving range are calculated.
A moving range measures how variation changes over time when data are collected as individual measurements rather than in subgroups.
If we collect individual measurements and need to plot the data on a control chart, or assess the capability of a process, we need a way to estimate the variation over time. But when we have individual observations, we cannot calculate the standard deviation for each subgroup. In such cases, the average moving range across all subgroups is an alternative way to estimate process variation.
Consider the 10 random data points plotted in the graph below:

A moving range is the distance or difference between consecutive points. For example, MR1 in the graph below represents the first moving range, MR2 represents the second moving range, and so forth:

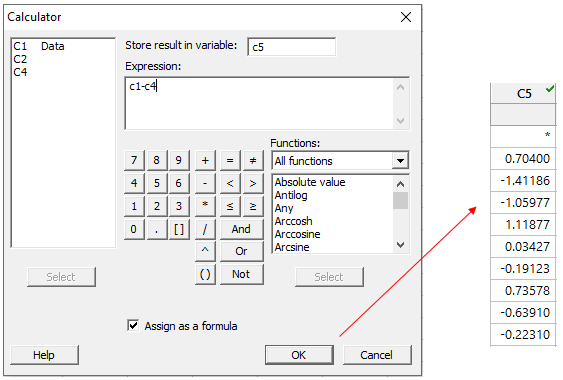
The difference between the first and second points (MR1) is 0.704, and that’s a positive number since the first point has a lower value than the second. The second moving range, MR2, is the difference between the second point (21.0494) and the third (19.6375), and that’s a negative number (-1.4119), since the third point has a lower value than the second. If we continue that way, we’ll have 9 moving ranges for our 10 data points.
In Minitab, a moving range is easy to compute by "lagging" the data. Continuing the example with the 10 data points above, I can use Stat > Time Series > Lag, and then complete the dialog box as shown below:
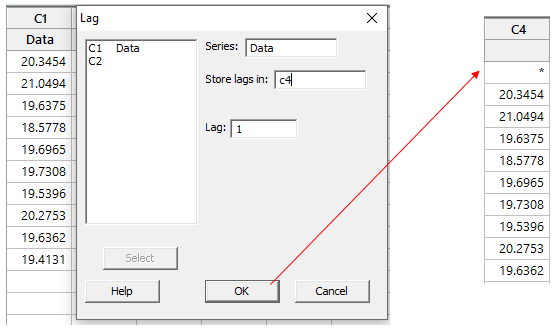
Clicking OK in the dialog above will shift the data in C1 down by one row and store the results in C4. Now we can use Calc > Calculator to subtract C4 from C1 and calculate all the moving ranges:
To calculate the average moving range, we need to use the absolute value of the moving ranges we calculated above. We’ll take a look at how to do that later.
When Minitab calculates the average of a moving range, the calculation also includes an unbiasing constant. The formula used to calculate the moving range is:
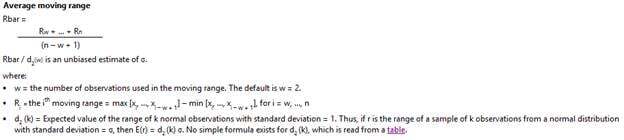
The table of unbiasing constants is available within Minitab and on this page.
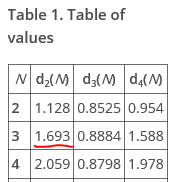
We’ve already done most of the work. To finish, we’ll find the right value of d2 in the table linked above, and use Minitab’s calculator to get the answer. We need the value of d2 that corresponds to a moving range of length 2 (that’s the number of points in each moving range calculation, but don’t worry, I’ll explain more about the length of the moving range later):

Now back to Minitab, and we can use Calc > Calculator to get our answer:
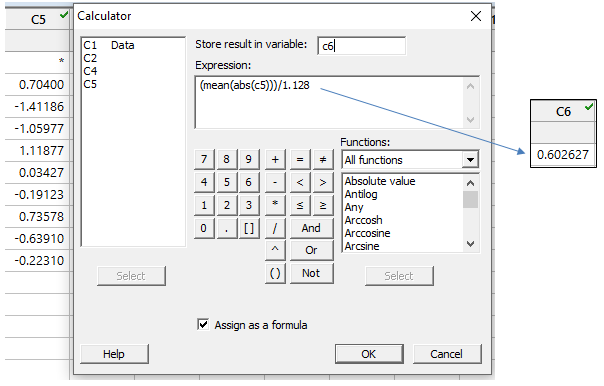
Using the formula above, we’re telling Minitab to use the absolute values (ABS calculator command) in C5 to calculate the mean, and then divide that by our unbiasing constant value of 1.128.
Now to check our results against Minitab, we can use Stat > Control Charts > Variables Charts for Individuals > I-MR and enter our original data column:

Next, choose I-MR Options > Storage, and check the box next to Standard deviations, then click OK in each dialog box:
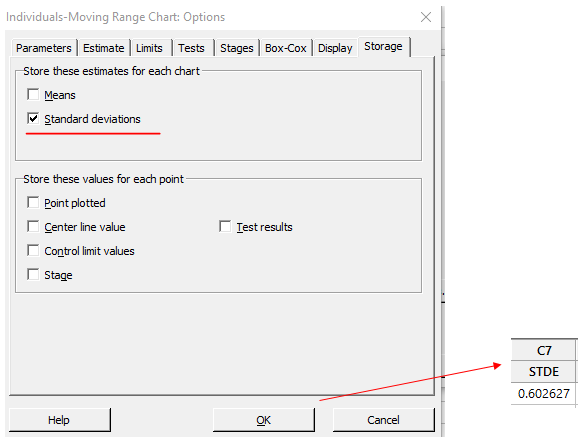
The results show the same average moving range value we calculated, 0.602627.
In this case, because we used a moving range of length 2, the average moving range gives us an estimate of the average distance between our consecutive individual data points. A moving range of length 2 is Minitab’s default, but that can be changed by clicking the I-MR Options button in the I-MR chart dialog, and then choosing the Estimate tab:

Here we can type in a different value (let’s use 3 as an example), and Minitab will use that number of points to estimate the moving ranges. If we did that for the calculations above, we’d have to make two adjustments:
-
We’d need to choose the correct value for the unbiasing constant, d2, that corresponds with a moving range length of 3:
- We’d have to adjust the number of points used for our moving ranges from 2 to 3. Using the same random data as before:

With three data points, we’ll use just the highest and the lowest values from the first 3 rows, so MR1 will be 21.0494 – 19.6375 = 1.4119.
If you’ve enjoyed this post, check out some of our other blog posts about control charts.