


When I wrote How to Calculate B10 Life with Statistical Software, I promised a follow-up blog post that would describe how to compute any “BX” lifetime. In this post I’ll follow through on that promise, and in a third blog post in this series, I will explain why BX life is one of the best measures you can use in your reliability analysis.
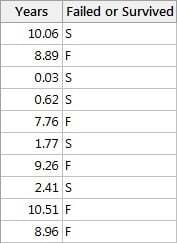
As a refresher, B10 life refers to the time at which 10% of the population has failed—or, to put it another way, it is the 90% reliability of a population at a specific point in time. Let’s revisit our pacemaker battery example from part 1 of this blog series. Here's the data.
Recall that we found the B10 life of pacemaker batteries to be 6.36 years. Another way to interpret this value is to say that 6.36 years is the time at which 10% of the population of pacemaker batteries will fail. This information is useful in establishing a realistic warranty period for a product so that customers are covered through a product’s 90% reliability period, and so the manufacturer won’t have to incur extra cost by replacing an excess of the product during the warranty period.
But perhaps a particular product has additional reliability requirements a manufacturer wishes to monitor, such as B15 life. Or perhaps we would like to know when half of the population will fail—its B50 life. Both B10 and B50 life are industry standards for measuring the life expectancy of an automotive engine, for instance. This is where BX life calculations become even more useful—and Minitab makes it incredibly easy to compute and interpret those values. (If you don't already have Minitab and you'd like to follow along, download the free trial.)
Calculating BX Life
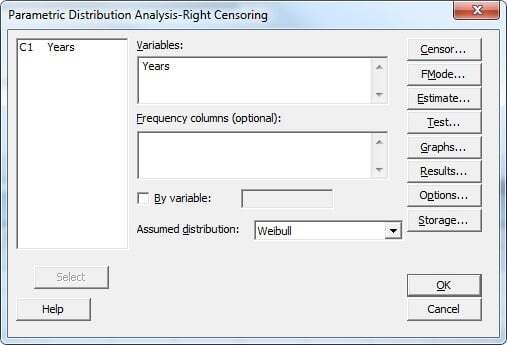
Navigate to Minitab’s Statistics > Reliability/Survival > Distribution Analysis (Right Censoring) > Parametric Distribution Analysis menu and set up the main dialog and the 'Censor' subdialog the same way we did in Part 1:
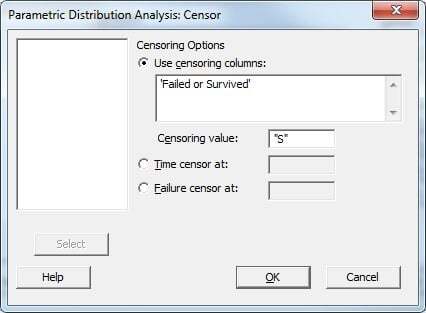
Press the "Censor" button and fill out the subdialog as follows:
When you press OK, Minitab analyzes the distribution of your data and by default will display a Table of Percentiles in the session window. We can take advantage of this table for measures such as B50 life, because the table produces output for a variety of percentiles by default. The percent of population failures at the 50th percentile is included in the default output.
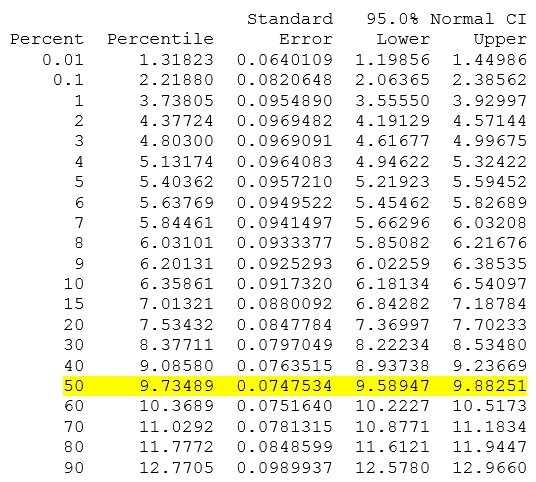
We see that 50% of the population of pacemaker batteries will fail by 9.735 years. But what if we want to compute B15 life? This percentile does not display by default in the Table of Percentiles.
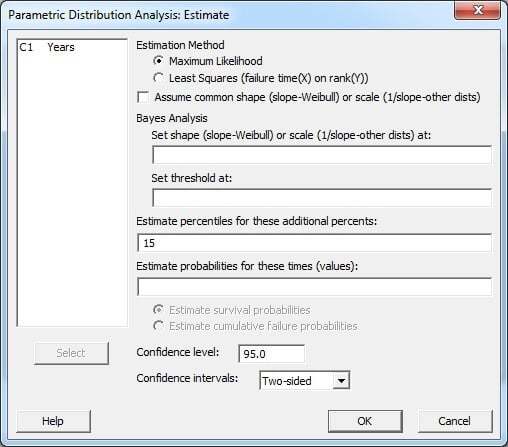
Revisiting the Parametric Distribution Analysis dialog (pressing CTRL-E is a Minitab shortcut that will bring up your most recently completed dialog), we can click the ‘Estimate’ button to specify what “BX” life we want. In the section titled ‘Estimate percentiles for these additional percents,’ entering the number 15 will give us the B15 life for pacemaker batteries.
Click OK through the dialogs, and we see that a row of output for the 15th percentile is now included in the Table of Percentiles.
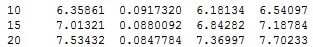
It’s as simple as that!
If you’ve never used BX life as a reliability metric, and you’re wondering just how and why these can be some of the best measures of reliability, stay tuned for my final post in this series!
Case study:
Time-to-Market and Design for Reliability at the Speed of Light in Signify
Get ready for a light bulb moment! In a fast-changing industry where time-to-market and product reliability give a competitive edge, discover how the world’s leading lighting company Signify, rapidly validates new innovations. In this one hour webinar, Prof W.D. van Driel and Dr P. Watté will shed a light on design for reliability (DfR) using Minitab Statistical Software at Signify, the former Philips Lighting. Learn from real-life examples their methods to lower your development costs, improve your designs’ performance and compliance, and accelerate the testing of product design reliability. If you develop products intended to meet high specifications for years to come, you will discover how to reduce the risks and consequences of product failure and costly claims - for you and your customers.

![[Webinar Replay] Time-to-Market and Design for Reliability at the Speed of Light at Signify](https://no-cache.hubspot.com/cta/default/3447555/b70a5a3e-03b6-408b-bbc1-7851ef13e4e9.png)