


We cannot improve what we cannot measure. Therefore, it is critical that we conduct a measurement systems analysis (MSA) before we start analyzing our data to make any kind of decisions.
When conducting an MSA for continuous measurements, we typically using a Gage R&R Study. And in these Gage R&R Studies, we look at output such as the percentage study variation (%Study Var, or %SV) and the Number of Distinct Categories (ndc) to assess whether our measurement system is adequate.
Looking at these 2 values to assess a measurement system often leads to questions like "Should I look at both values? Will both values simultaneously indicate if my measurement system is poor? Are these 2 values related?"
The answer to all of these questions is "Yes," and here's why.
How Are NDC and %Study Var Related?
To clearly understand how number of distinct categories and percentage study variation are related, first consider how they are mathematically defined:
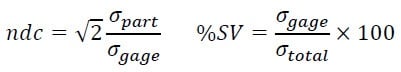
where sigma represents the square root of the variance components. (Note that where the square root of 2 appears in this formula and those below, Minitab uses 1.41.)
Using substitution, we can express the relationship between ndc and %SV as:
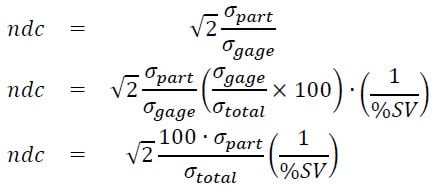
The last equation shows that ndc and %SV are inversely proportional: the larger %SV is, the smaller the ndc is, and vice-versa. However, it also suggests that the value of ndc depends not only on %SV, but on the variance components as well.
NDC as a Function of %SV
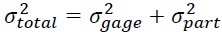
To simplify the equation and represent ndc solely as a function of %SV, we can express the variance components in another way. The total variance is the sum of two variance components, one corresponding to gage repeatability and reproducibility and the other to part-to-part variation:
Solving for sigma-squared for part and dividing each side of the equation by sigma-squared for total yields:
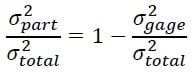
Because %SV / 100 = sigma gage / sigma total, the equation above can be rewritten as:
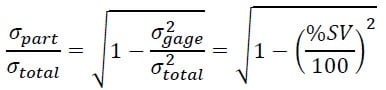
Substituting this value into the previous equation for ndc gives the following simplified formula:
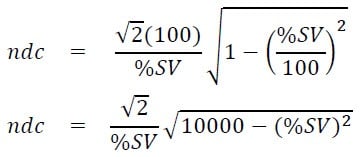
This equation clearly shows the relationship between ndc and %SV and can be used to calculate the number of distinct categories for a given percentage study variation. As shown in Table 1, the calculated ndc value is then truncated to obtain a whole number (integer).
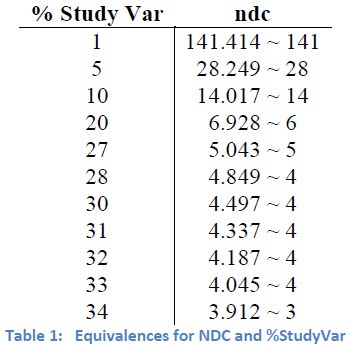
For example, if the calculated value is 15.8, mathematically you are not quite capable of differentiating between 16 categories. Therefore, Minitab Statistical Software is conservative and truncates the number of distinct categories to 15. For practical purposes, you can also round the calculated ndc values to obtain the number of distinct categories.
Guidelines and Limitations for Evaluating a Measurement System Using NDC
You can evaluate a measurement system by looking only at the number of distinct categories and using the following guidelines (based on the truncation method used by Minitab):
- ≥ 14 distinct categories – The measurement system is acceptable.
- 4-13 distinct categories – The measurement system is marginally acceptable, depending on the importance of the application, cost of measurement device, cost of repair, and other factors.
- ≤ 3 distinct categories – The measurement system is unacceptable and should be improved.
These guidelines have some limitations. For example, in some cases when the %SV is over 30% the number of distinct categories is 4. Therefore, a measurement system with 32% study variation, which is unacceptable under the AIAG criteria for %SV, is acceptable under the ndc criteria. To avoid this discrepancy, some authors suggest only accepting a measurement system when it can distinguish between 5 or more categories. Although this fixes the original problem, it makes measurement systems with a 28-30% study variation unacceptable, because their corresponding ndc value equals 4.
To resolve this issue you can establish more specific guidelines based on the exact calculated ndc values, without truncating or rounding. For example, you could define an unacceptable measurement system based on an ndc < 4.497.
And that is how the number of distinct categories is related to %Study Var.