


I couldn’t wait to get to the Guinness brewery after landing in Dublin. Yes, I was eager to taste a pint nearly fresh off the line, but I was also curious to see if there would be any indication that the brewery was home to arguably one of THE most important developments in the field of statistics. I was not disappointed.
There on the wall in the old Guinness Storehouse was a lone plaque paying homage to William Sealy Gosset. Unfortunately, none of the other tourists had a clue why my husband and I hurried towards it to snap some photos. But I digress...
More than a century ago, and well before the dawn of Six Sigma, Guinness understood the importance of quality control. Starting in the early 1900s, Guinness began recruiting scientists as Master Brewers to apply scientific methods to beer production. To brew the perfect pint, Guinness needed to make sure that the ingredients they used to brew beer met their high standards. These ingredients included water straight from the Wicklow Mountains, hops, yeast and of course the barley that gives Guinness its rich distinctive color and taste.
Enter Brewer, Chemist & Statistician: W. S. Gosset
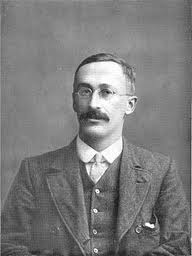 One such scientist and brewer by the name of Gosset was tasked with studying and testing these essential ingredients to ensure that every pint was brewed to perfection. However, back in his day, statistical tests for averages were traditionally conducted using large sample sizes rather than the small, cost-effective samples Gosset was using. And Gosset recognized that statistical methods based on large samples would not work in the case of small ones.
So what’s a statistician to do? Well, he got to work and came up with a statistical method to effectively analyze these small samples and their means. And so the t-test was born.
Guinness understandably didn’t want their competitors to know what they were up to. Instead of publishing his findings under his own name, and potentially tipping off the competition as to how they were utilizing statistics to make a better brew, Gosset publicized his work under the penname ‘Student.’ This is why today we have what is known as the ‘Student t-test’ and not the Gosset t-test. Who knew the statistical world could be associated with a little bit of mystery and drama? Or beer, for that matter?
Proving Guinness Really Does Taste Better in Ireland
Now that you know about the history of the t-test, let me also let you in on a little secret—Guinness really does taste better in Ireland. I can attest to this from personal experience, and the results of the Guinness Overall Enjoyment Score (GOES) and the t-test prove it.
Using the GOES rating system (also referred to as the Visual Analogue Scale in some articles), researchers from 4 different countries traveled to different pubs around the world collecting data on the taste of Guinness. What a rough job that must have been!
By the end of their travels, pints consumed in Ireland received a mean GOES score of 74, while the average GOES score for Guinness tasted elsewhere was 57. Now is this difference of 74 versus 57 significant, or is it simply due to natural, random variation? Enter the t-test.
Suppose this is a summary of the data that was collected:
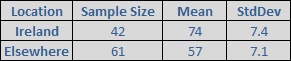
Much like the 4 researchers must have done, we can use Minitab Statistical Software to run a t-test to analyze these averages. With a p-value less than 0.001, the researchers were able to reject the null hypothesis (of no difference) and conclude that in fact Guinness served in an Irish pub tastes significantly better than pints served elsewhere around the globe. Brilliant!