


An outlier is an observation in a data set that lies a substantial distance from other observations. These unusual observations can have a disproportionate effect on statistical analysis, such as the mean, which can lead to misleading results. Outliers can provide useful information about your data or process, so it's important to investigate them. Of course, you have to find them first.
Finding outliers in a data set is easy using Minitab Statistical Software, and there are a few ways to go about it.
Finding Outliers in a Graph
If you want to identify them graphically and visualize where your outliers are located compared to rest of your data, you can use Graph > Boxplot.
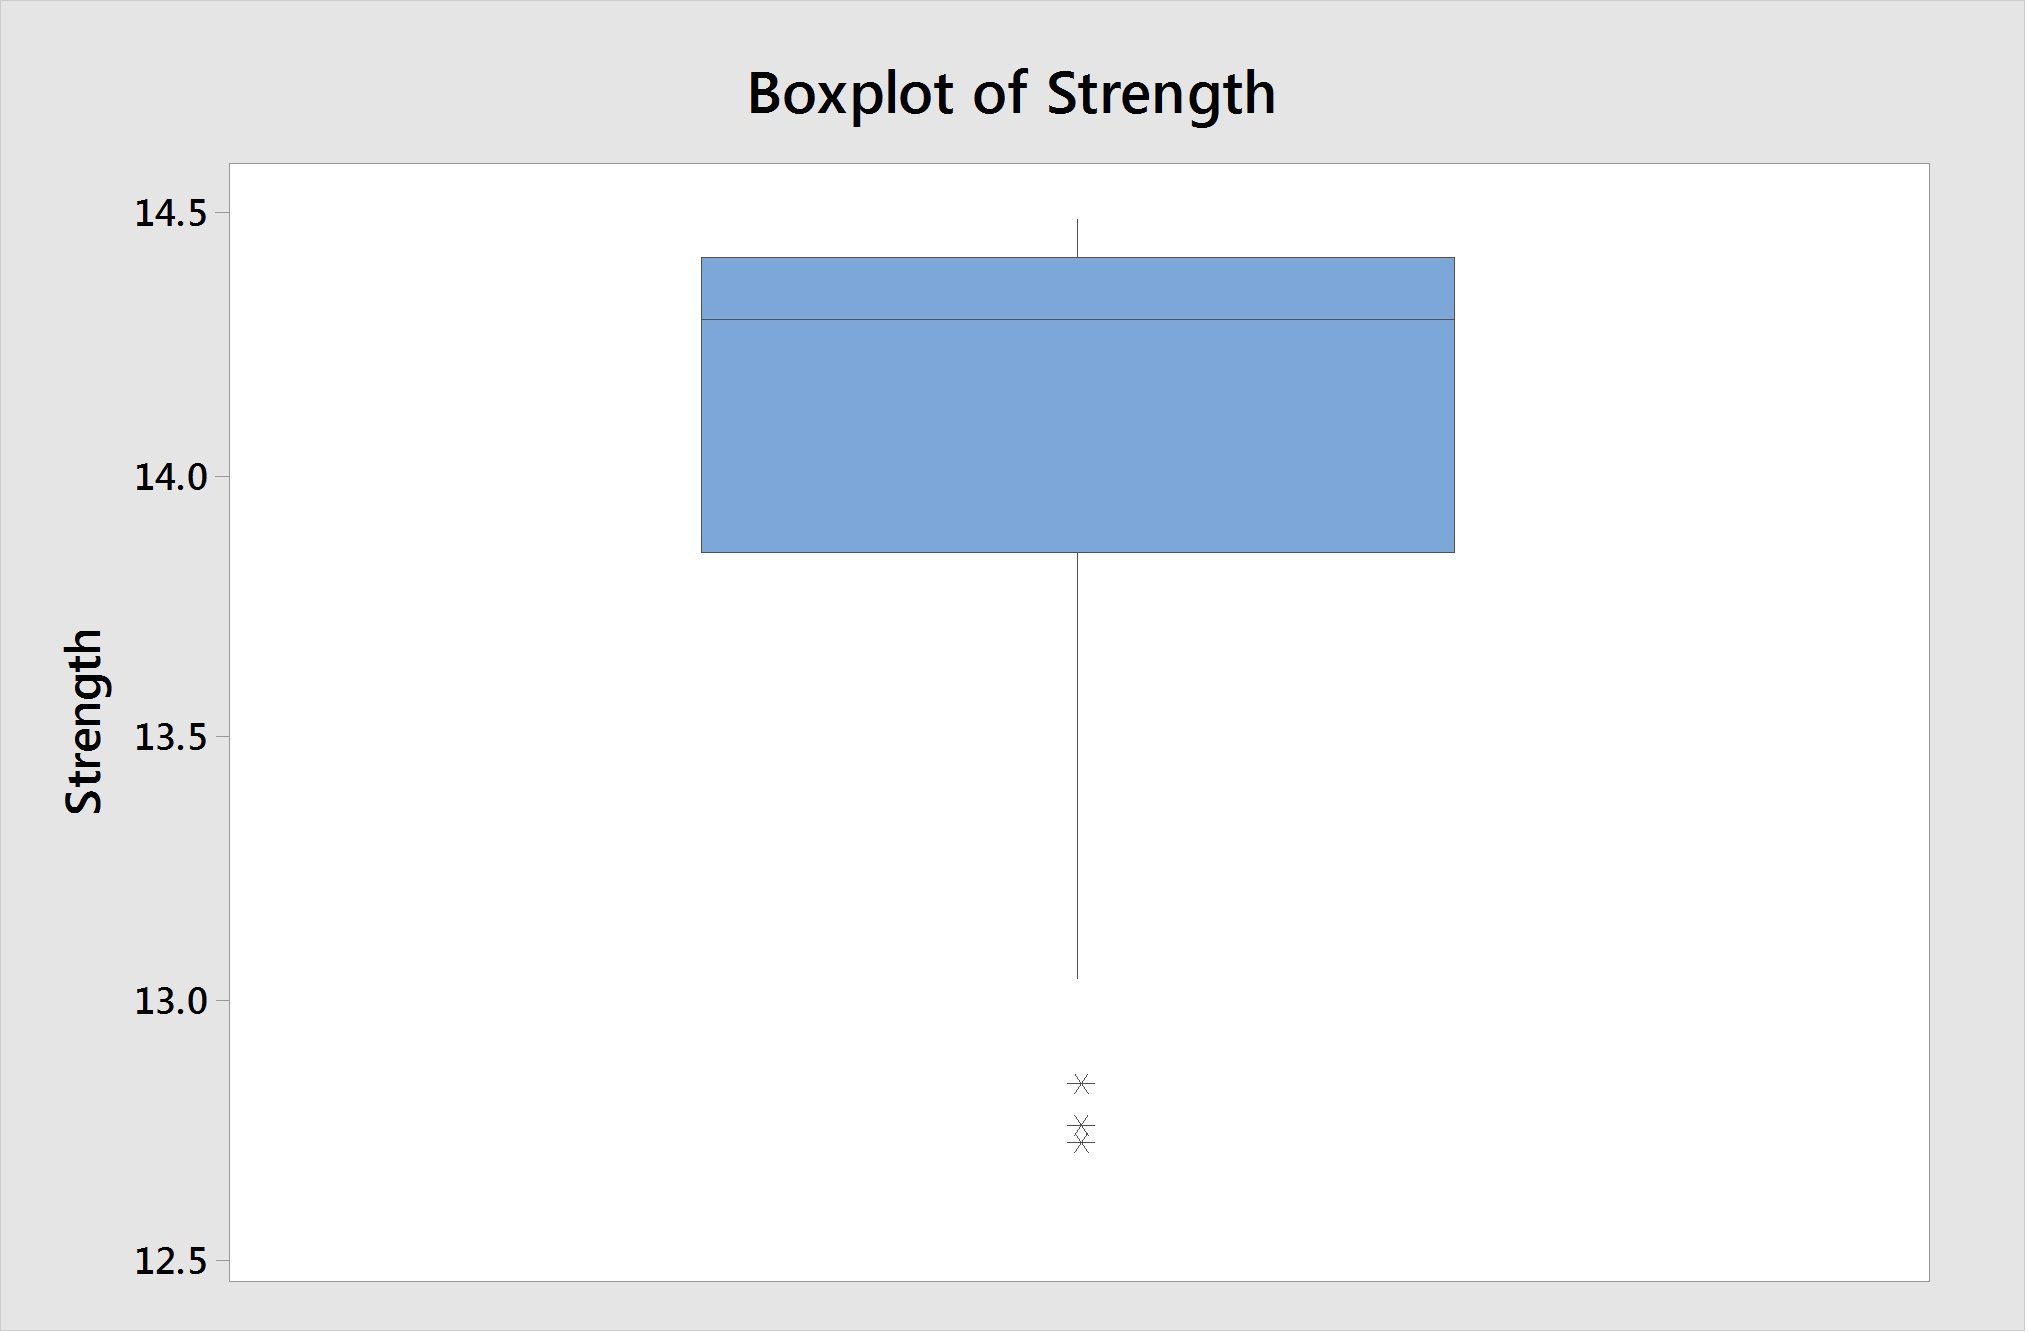
This boxplot shows a few outliers, each marked with an asterisk. Boxplots are certainly one of the most common ways to visually identify outliers, but there are other graphs, such as scatterplots and individual value plots, to consider as well.
Finding Outliers in a Worksheet
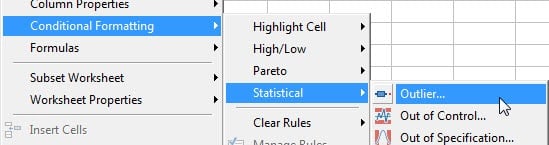
To highlight outliers directly in the worksheet, you can right-click on your column of data and choose Conditional Formatting > Statistical > Outlier. Each outlier in your worksheet will then be highlighted in red, or whatever color you choose.
Removing Outliers
If you then want to create a new data set that excludes these outliers, that’s easy to do too. Now I’m not suggesting that removing outliers should be done without thoughtful consideration. After all, they may have a story – perhaps a very important story – to tell. However, for those situations where removing outliers is worthwhile, you can first highlight outliers per the Conditional Formatting steps above, then right-click on the column again and use Subset Worksheet > Exclude Rows with Formatted Cells to create the new data set.
The Math
If you want to know the mathematics used to identify outliers, let's begin by talking about quartiles, which divide a data set into quarters:
- Q1 (the 1st quartile): 25% of the data are less than or equal to this value
- Q3 (the 3rd quartile): 25% of the data are greater than or equal to this value
- IQR (the interquartile range): the distance between Q3 – Q1, it contains the middle 50% of the data
Outliers are then defined as any values that fall outside of:
Q1 – (1.5 * IQR)
or
Q3 + (1.5 * IQR)
Of course, rather than doing this by hand, you can leave the heavy-lifting up to Minitab and instead focus on what your data are telling you.