


Back when I was an undergrad in statistics, I unfortunately spent an entire semester of my life taking a class, diligently crunching numbers with my TI-82, before realizing 1) that I was actually in an Analysis of Variance (ANOVA) class, 2) why I would want to use such a tool in the first place, and 3) that ANOVA doesn’t necessarily tell you a thing about variances.
Fortunately, I've had a lot more real-world experience to draw from since then, which makes it much easier to understand today. TI-82 not required.
Why Conduct an ANOVA?
In its simplest form—specifically, a 1-way ANOVA—you take 1 continuous (“response”) variable and 1 categorical (“factor”) variable and test the null hypothesis that all group means for the categorical variable are equal. Typically, we’re talking about at least 3 groups, because if you only have 2 groups (samples), then you can use a 2-sample t-test and skip ANOVA all together.
As an example, let’s look at the average annual per capita beer consumption across 3 regions of the world: Asia, Europe, and America. Here’s the null and alternative hypothesis:
H0: All regions drink the same average amount of beer (μAsia = μEurope = μAmerica)
H1: Not all regions drink the same average amount of beer
Any guess on who consumes the most beer?
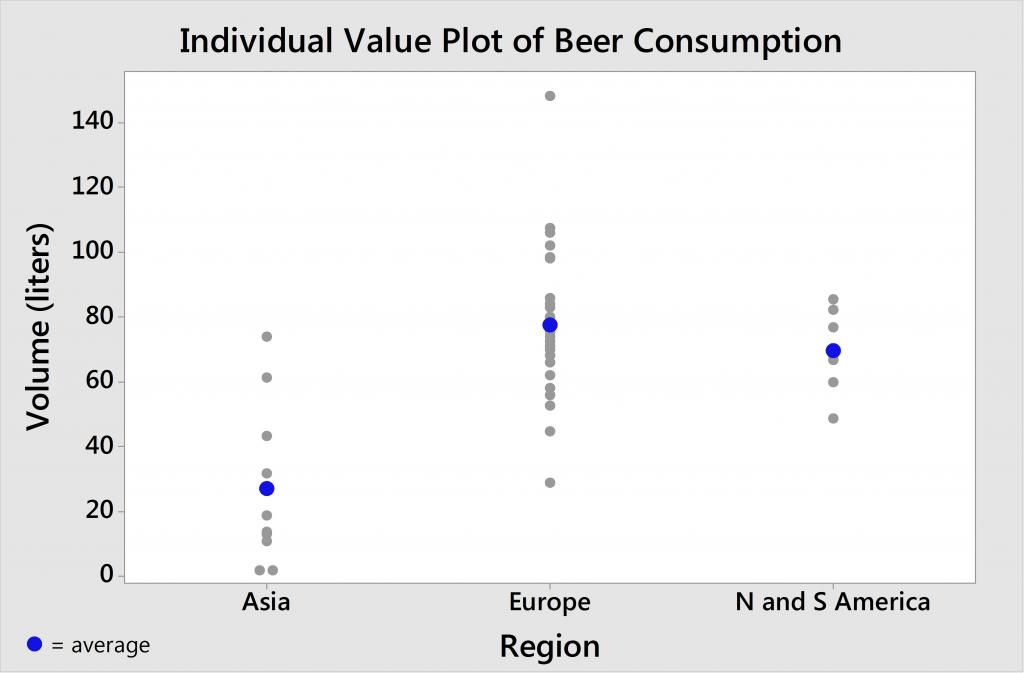
According to the individual value plot created using Minitab Statistical Software, Europe consumes the most beer on average and Asia consumes the least. However, are these differences statistically significant? Or are these differences simply due to random variation?
How ANOVA Works
The basic logic behind ANOVA is that the within-group variation is due only to random error. Therefore:
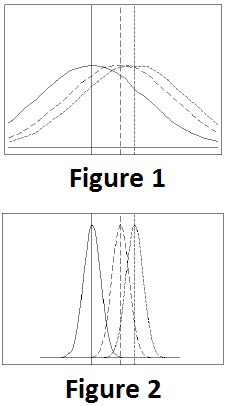 If the between-group variation is similar to the within-group variation, then the group means are likely to differ only due to random error. (Figure 1)
- If the between-group variation is large relative to the within-group variation, then there are likely differences between the group means. (Figure 2)
Say what?
In our example, the between-group variation represents the variation between the 3 different regions. And the within-group variation represents the beer consumption variability within a given region. Take Europe, for instance, where we have the Czech Republic. It appears to be the thirstiest country, consuming the most beer at 148.6 liters. But Europe also contains Italy, whose population drinks the least at only 29 liters (perhaps the Italians are passing up the Peroni for some vino and Limoncello?). So you can see that there is variability within the Europe group. There’s also variability within the Asia group, and within the America group.
With ANOVA, we compare the between-group variation (i.e., Asia vs. Europe vs. America) to the within-group variation (i.e., within each of those regions). The higher this ratio, the smaller the p-value. So the term ANOVA refers to the fact that we're using information about the variances to draw conclusions about the means.
The Analysis
If we run a 1-way ANOVA using this beer data, Minitab Statistical Software provides the following output in the Session Window:
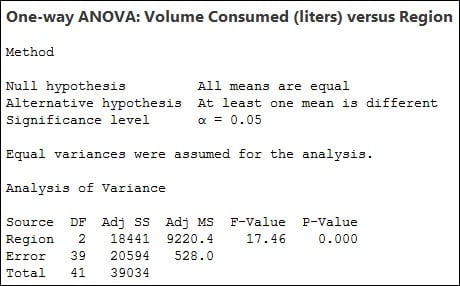
Our p-value is statistically significant at 0.000. Therefore, we can reject the null hypothesis that all regions drink the same average amount of beer.
This leads us to our next question: Which countries differ? Let’s use Tukey multiple comparisons to find out.
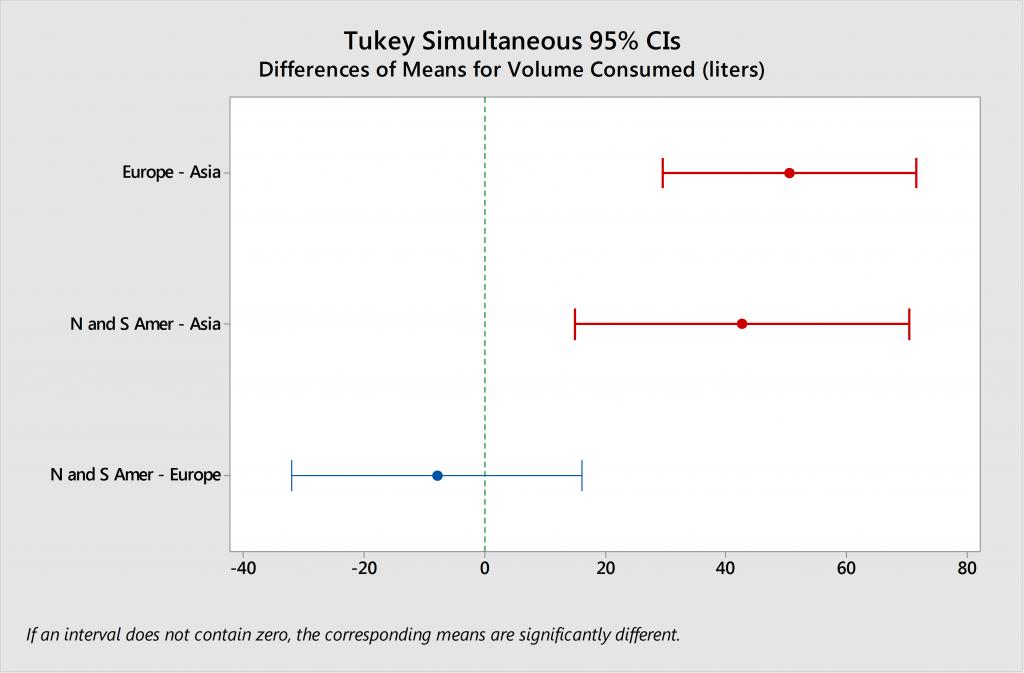
Per the footnote on the Tukey comparisons graph, “If an interval does not contain zero, the corresponding means are significantly different.” Therefore, the intervals shown in red tell us where the differences are. Specifically, we can conclude that the average beer consumption for Europe is significantly higher than that of Asia. We can also conclude that America consumes significantly more than Asia. However, there is not sufficient evidence to conclude that the average beer consumption for Europe is different than for America.
The Last Sip
Although it’s unlikely that you’re analyzing beer data in your professional career, I do hope this provides a little insight into ANOVA and how you can utilize it to test averages between 3 or more groups.