


If you need to assess process performance relative to some specification limit(s), then process capability is the tool to use. You collect some accurate data from a stable process, enter those measurements in Minitab, and then choose Stat > Quality Tools > Capability Analysis/Sixpack or Assistant > Capability Analysis.
Now, what about sorting the data? I’ve been asked “why does Cpk change when I sort my data?” many times during my years at Minitab, so if you’ve wondered the same thing, here’s your answer.
From Soap to Standard Deviations
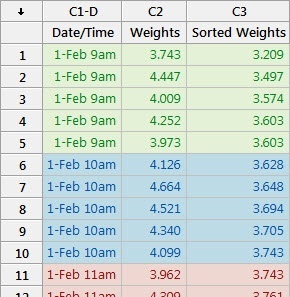
Suppose you work for a company that manufactures bars of soap. Each bar should weigh between 3.2 and 5.2 ounces. To conduct the study, you randomly select 5 bars of soap every hour from the production line and weigh them.
You can see from the spreadsheet that at 9 a.m. on February 1, the 5 bars weighed in at 3.743, 4.447, 4.009, 4.252 and 3.973 ounces. These 5 measurements make up our first subgroup. For our second subgroup, we have the 5 bar weights corresponding to 10 a.m., and 11 a.m. data for the third subgroup, and so on.
To calculate Cpk, Minitab first computes the pooled standard deviation. Without getting into the specific mathematics of the pooled standard deviation formula, you can basically think of it as the average of all of the subgroup standard deviations. In other words, if we calculate the standard deviation for rows 1-5 (subgroup #1), then the standard deviation for rows 6-10 (subgroup #2), then the standard deviation for rows 11-15 (subgroup #3), etc., and then calculate the average of those standard deviations, we (more or less) arrive at the pooled standard deviation.
Therefore, the pooled standard deviation only accounts for the variability within subgroups—it does not include the shift and drift between them. If you want to account for all of the variability across all of the data, then you should look at the overall standard deviation, and use Ppk rather than Cpk.
The Sordid Details
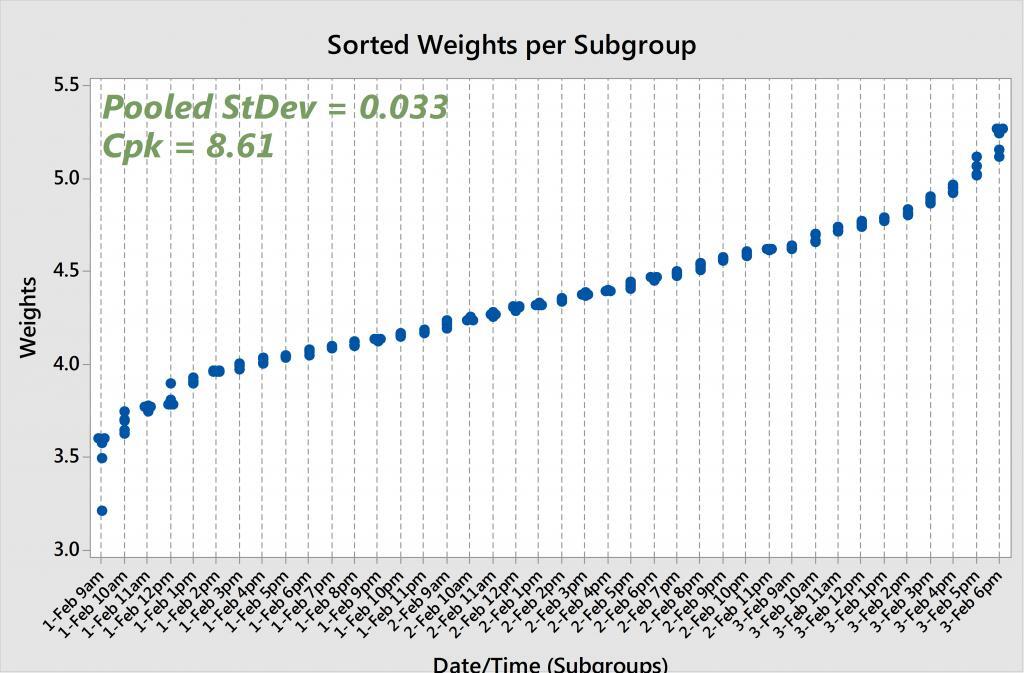
Now let’s sort this data from smallest to largest and see what happens to the pooled standard deviation and Cpk. If we calculate the subgroup standard deviations for the sorted rows 1-5, then 6-10, then 11-15, etc., we’re going to arrive at much smaller values than the original subgroup standard deviations because we’ve minimized the variability within each subgroup. And the smaller the subgroup standard deviations, the smaller the pooled standard deviation, and thus the larger the Cpk statistic.
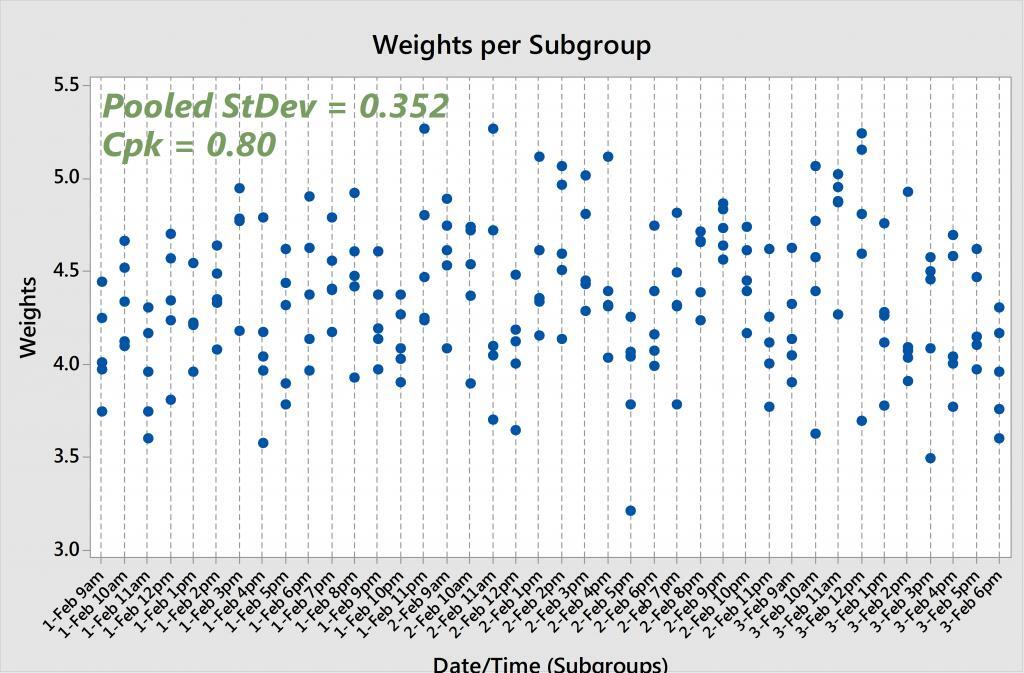
If we look at the original, unsorted soap weights and run capability analysis, we get a pooled (also known as “within”) standard deviation of 0.352 and a Cpk of 0.80. And if we re-run the analysis on the sorted soap weights, we arrive at a pooled standard deviation of 0.033 and a Cpk of 8.61. That's two completely different sets of results! The original—and accurate—Cpk is below the 1.33 rule-of-thumb, while the other Cpk is exceptionally larger than 1.33.
The Moral of the Subgroup Story
I hope it's now clear why we should not sort our data when running capability analysis. Subgroups are intended to provide information regarding the natural variability of a process at a given point in time. By sorting the data, we are looking at an inaccurate picture of the true subgroup variability, and thereby inflating Cpk to an unrealistic value.