


I recently fielded an interesting question about the probability and survival plots in Minitab Statistical Software's Reliability/Survival menus:
Is there a one-to-one match between the confidence interval points on a probability plot and the confidence interval points on survival plot at a specific percentile?
Now, this may seem like an easy question, given that the probabilities on a survival plot are simply 1 minus the failure probabilities on a probability plot at a specific time t or stressor (in the case of Probit Analysis, used for our example below).
This can be seen here, at the 10th percentile:
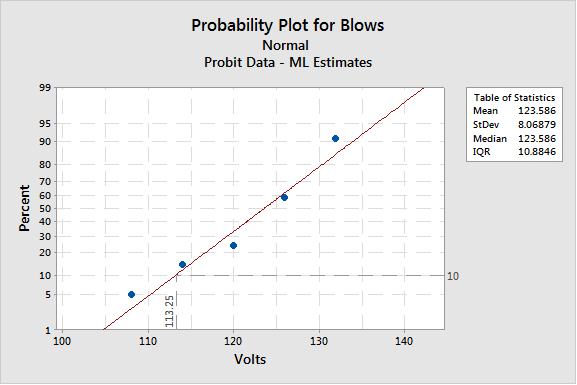
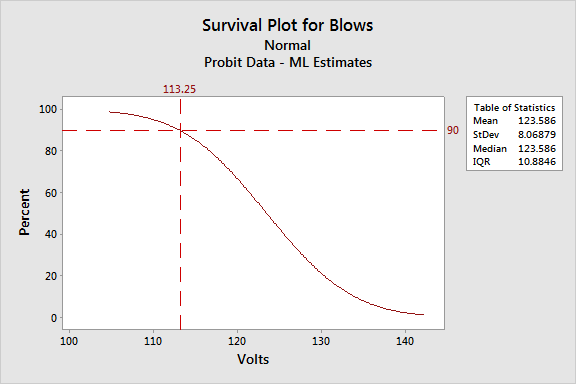
The probability plot is saying that at a voltage of 113.25, 10% of your items are failing. Conversely, the survival plot will show that 90% of your items will survive at that same voltage.
How do the graphs compare when adding confidence intervals to both graphs? Before we get our hands dirty with this, let’s first review some terms and methods to get us comfortable enough to proceed further.
Reliability/Survival Analysis
This is the overarching classification of tools within Minitab that help with modeling life data. Distribution Analysis, Repairable Systems Analysis, and Probit Analysis fall within this category.
Probit Analysis
This analysis will be used as our example today. Probit analysis is used when you want to estimate percentiles and survival probabilities of an item in the presence of a stress. The response is required to be binomial in nature (go/no go, pass/fail). One example of a probit analysis could be testing light bulb life at different voltages.
Since the response data is binomial, you’d have to specify what would be a considered an event for that light bulb at a certain voltage. Let’s say the event is a light bulb blowing out before 800 hours.
Excerpt of data set
| Blows(The Event) | Trials | Volts |
| 2 | 50 | 108 |
| 6 | 50 | 114 |
| 11 | 50 | 120 |
| 45 | 50 | 132 |
Probability Plot
This graph plots each value against the percentage of values in the sample that are less than or equal to it, along a fitted distribution line (middle line). In probit analysis, it helps determine, at certain voltages, what the percentage of bulbs fail before 800 hours.
Survival Plot
This graph displays a plot of the survival probabilities versus time. Each plot point represents the proportion of units surviving at time t. In probit analysis, it helps determine, at a certain voltages, what the percentage of bulbs survive beyond 800 hours.
Back to the original question…
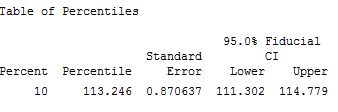
Can we take a value along the CI of a probability plot and find its corresponding value on the CI of survival plot at a specific percentile? Here are the confidence interval values for the percentile at 113.246:
If we add the above confidence interval values for the 10th percentile to the survival plot, you'll see that they don’t quite equal what’s shown at 90%. They’re a little off:
The Reason
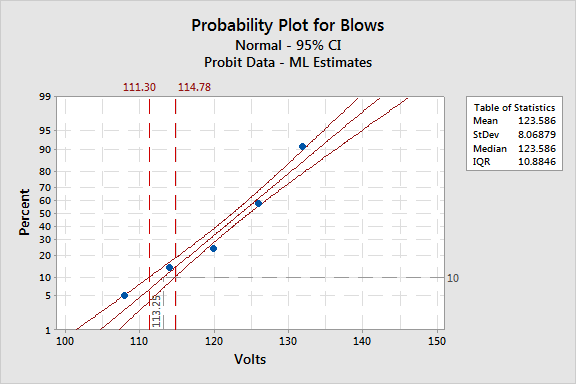
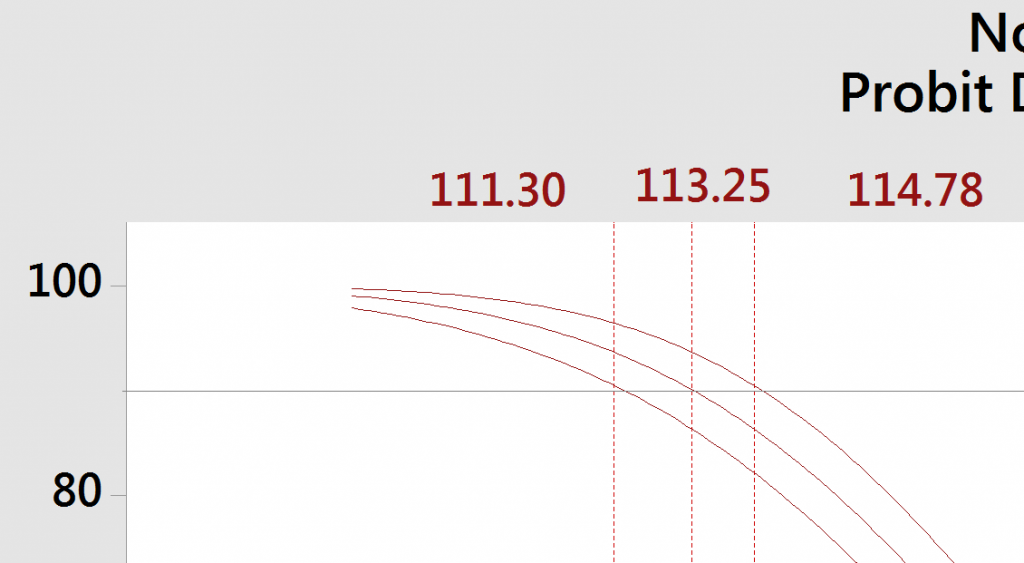
In our probability plot, the confidence interval is calculated with the parameter of interest being the percentile. Let’s look at the 10th percentile again:
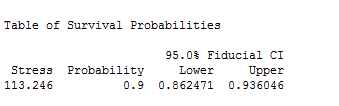
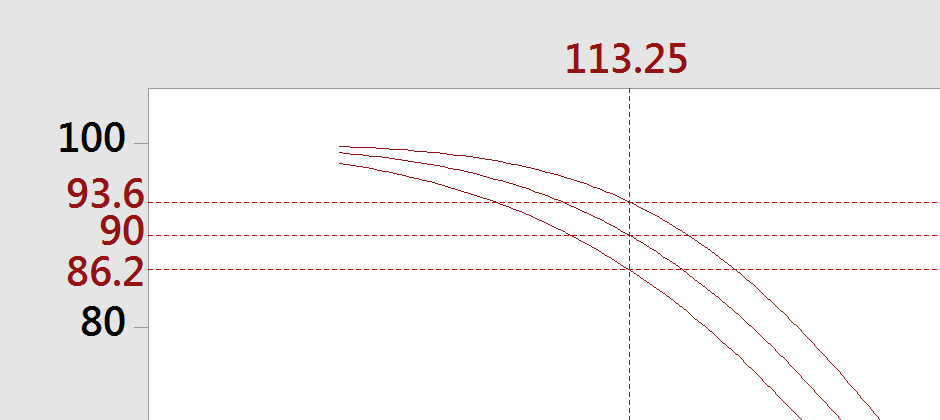
Our 95% CI (111.302 to 114.779) is around the value of 113.246 volts. In our survival plot, the confidence interval is calculated around the probability of survival. You can see this in the session window under the Table of Survival Probabilities. The 95% CI around the survival probability of 0.90 for a voltage of 113.246:
Here’s another look at our survival plot with our aforementioned survival probabilities added:
They all nicely fit on one straight vertical line at voltage = 113.246.
This all being said, you can convert the lower bound or upper bound of a percentile to a point on a survival plot. Let’s say we look at the lower bound for 113.246 (which is 111.302). We’d first have to find the survival probability for that value:
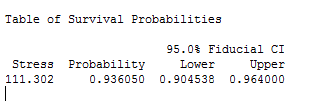
Now let’s look at that table of survival probabilities for 0.90 again:
Notice that the survival probability for the lower CI of 113.246 ends up being the upper bound of the survival probability of 0.90. Given that the survival probabilities are one minus the failure probabilities, it makes sense that you'd have to look at the upper bound of a survival plot when analyzing the lower bound of a probability plot.
I hope this post helps you develop a deeper understanding of the relationship between our probability and survival plots—and I hope it wasn't too technical!
Please check out these other posts on Reliability/Survival:
Probit Analysis: Down Goes the Meathouse!
The Care and Feeding of Capital Equipment( with Reliability Statistics)