Don't be a grumpy cat when something on your capability report doesn't smell right. After pressing that OK button to run your analysis, allow your inner cat to understand how and why certain statistics are being used. To help you along, here are some capability issues that customers have brought up recently.
Cp is missing
You’ve generated a capability analysis report with the Johnson transformation and don’t see a table for your Potential (Within) Capability metrics, i.e., Cp and Cpk:

You would use a transformation method like Johnson or Box-Cox when your data is non-normal. The transformation will attempt to convert the data into something more approximately normal. The problem lies with how the transformations handle subgrouping. The Johnson transformation unfortunately doesn’t use subgrouping, as it considers all of the data to be part of the same group prior to transformation. Therefore, it's impossible to calculate within-subgroup capability indices, and hence Minitab only displays overall capability metrics.
Fortunately, when you apply the Box-Cox transformation, Minitab does calculate the within-subgroup capability indices, because the Box-Cox method is able to preserve the grouping information of your measurements into subgroups. This allows Minitab to display metrics for within-subgroup capability and overall capability.
Asterisks for Metrics
Your Process Capability Report is displaying asterisks for some of your capability metrics, as shown below:
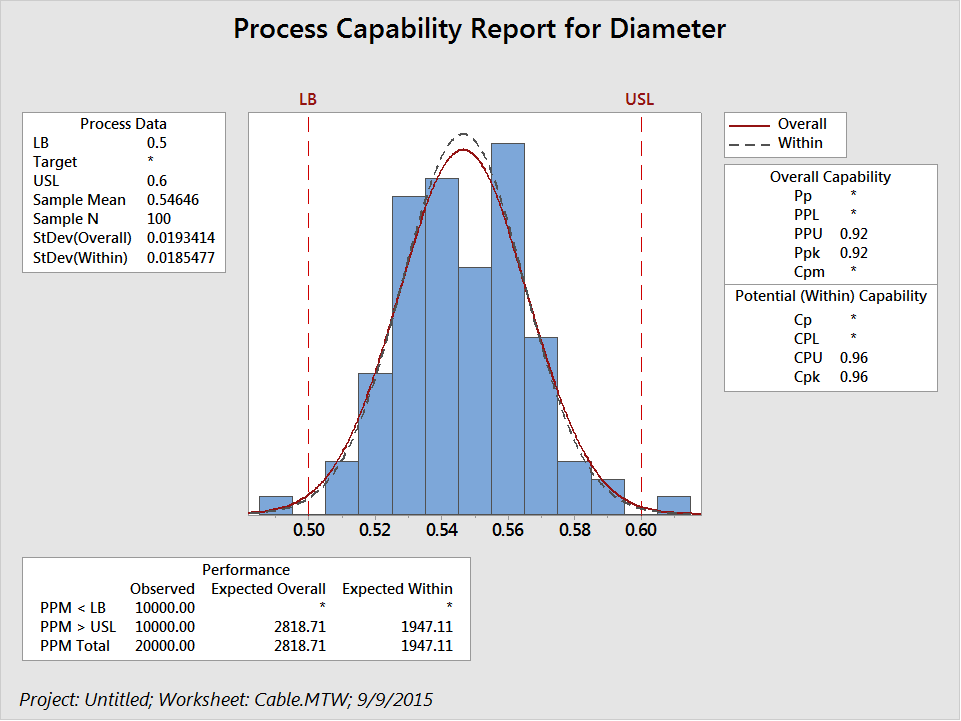
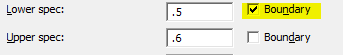
The answer to this riddle lies in the graph itself. The user entered in a lower boundary instead of a lower spec. Thus, the red vertical line on the left is labelled LB instead of LSL, which is an abbreviation for lower specification limit. Under the capability analysis dialog menu, check the ‘Boundary’ box only if it’s impossible for a defect to fall beyond that spec. Otherwise, leave the box unchecked.
Cp Is Present When the Subgroup Size Is 1
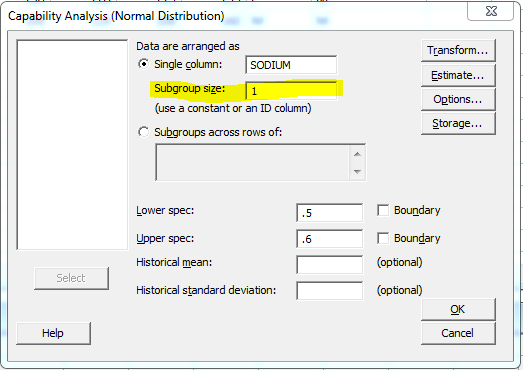
If you do not have subgrouping in your capability analysis, you can enter in a value of 1 in the box entitled Subgroup size:
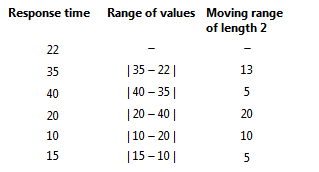
If you were expecting to just see overall statistics in your graph, you will be in for a surprise. Fortunately, Minitab will still display Cp metrics on the report for measuring the Potential(Within) Capability. We end up measuring the within standard deviation by using the average moving range method. In the absence of subgrouping, this will allows us to still track process variation. An example of calculating moving ranges is shown below.
Ppk > Cpk
When Cpk > Ppk, it means that if you are able to eliminate assignable causes that occur in between subgroups in the long-term or overall process, then your process has the potential to improve and become more capable. What about when Ppk > Cpk? Although it is unusual for Ppk to be larger than Cpk, it can happen on occasion.
We see this more often when using a subgroup size of 1 as opposed to larger subgroups. As mentioned above, when the subgroup size is 1, we estimate the within-subgroup standard deviation using the average moving range method. If there is a lot of variation between consecutive observations (for example, when the data alternate between a low and a high value), it is possible that the calculations will yield a within standard deviation that is larger than the overall standard deviation. As a result, the Cpk will be smaller than the Ppk.
Missing the Target
When you generate a capability analysis, you may see a metric called Cpm under Overall Capability. By default, this will show up as an asterisk in your report. This is because Cpm requires the input of a target, which needs to be entered under the Options sub-menu of Capability Normal:
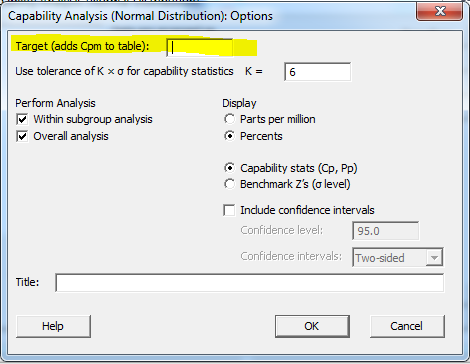
You can then assess if your process is on target in addition to being within specification and see an actual value for Cpm on your Capability Report. If, by chance, your target ends up being the same as your data’s sample mean, you’ll find that your Cpm equals the Ppk.
If you don’t have a target at all, that’s okay—it's not required that you have one to run the analysis.
Hopefully, your inner cat feels better about performing a capability analysis in Minitab after understanding the logic behind these potential scenarios!