


It's all too easy to make mistakes involving statistics. Powerful statistical software can remove a lot of the difficulty surrounding statistical calculation, reducing the risk of mathematical errors—but correctly interpreting the results of an analysis can be even more challenging.
No one knows that better than Minitab's technical trainers. All of our trainers are seasoned statisticians with years of quality improvement experience. They spend most of the year traveling around the country (and around the world) to help people learn to make the best use of Minitab software for analyzing data and improving quality.
A few years ago, Minitab trainers compiled a list of common statistical mistakes—the ones they encountered over and over again. Below are a few of their most commonly observed mistakes that involve drawing an incorrect conclusion from the results of analysis.
Statistical Mistake 1: Misinterpreting Overlapping Confidence Intervals
When comparing multiple means, statistical practitioners are sometimes advised to compare the results from confidence intervals and determine whether the intervals overlap. When 95% confidence intervals for the means of two independent populations don’t overlap, there will indeed be a statistically significant difference between the means (at the 0.05 level of significance). However, the opposite is not necessarily true. CI’s may overlap, yet there may be a statistically significant difference between the means.
Take this example:
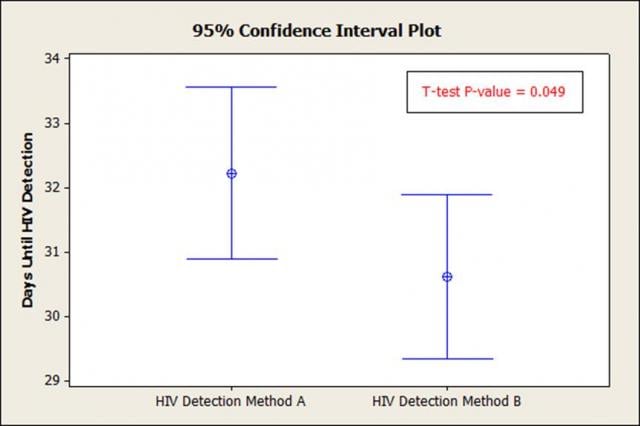
Two 95% confidence intervals that overlap may be significantly different at the 95% confidence level.
What is the significance of the t-test P-value? The P-value in this case is less than 0.05 (0.049 < 0.05), telling us that there is a statistical difference between the means, (yet the CI's overlap considerably).
Statistical Mistake 2: Making Incorrect Inferences about the Population
With statistics, we can analyze a small sample to make inferences about the entire population. But there are a few situations where you should avoid making inferences about a population that the sample does not represent:
- In capability analysis, data from a single day is sometimes inappropriately used to estimate the capability of the entire manufacturing process.
- In acceptance sampling, samples from one section of the lot are selected for the entire analysis.
- A common and severe case occurs in a reliability analysis when only the units that failed are included in an analysis and the population is all units produced.
To avoid these situations, define the population before sampling and take a sample that truly represents the population.
Statistical Mistake 3: Assuming Correlation = Causation
It’s sometimes overused, but “correlation does not imply causation” is a good reminder when you’re dealing with statistics. Correlation between two variables does not mean that one variable causes a change in the other, especially if correlation statistics are the only statistics you are using in your data analysis.
For example, data analysis has shown a strong positive correlation between shirt size and shoe size. As shirt size goes up, so does shoe size. Does this mean that wearing big shirts causes you to wear bigger shoes? Of course not! There could be other “hidden” factors at work here, such as height. (Tall people tend to wear bigger clothes and shoes.)
Take a look at this scatterplot that shows that HIV antibody false negative rates are correlated with patient age:
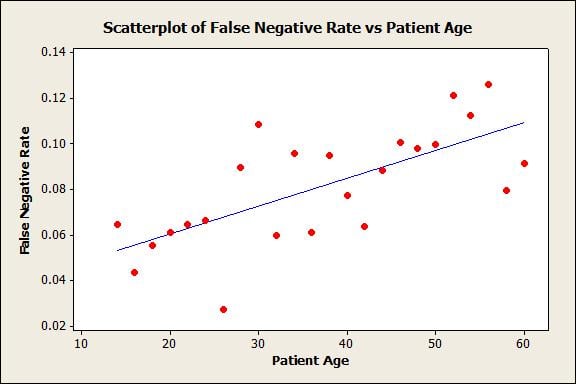
Does this show that the HIV antibody test does not work as well on older patients? Well, maybe …
But you can’t stop there and assume that just because patients are older, age is the factor that is causing them to receive a false negative test result (a false negative is when a patient tests negative on the test, but is confirmed to have the disease).
Let’s dig a little deeper. Below you see that patient age and days elapsed between at-risk exposure and test are correlated:
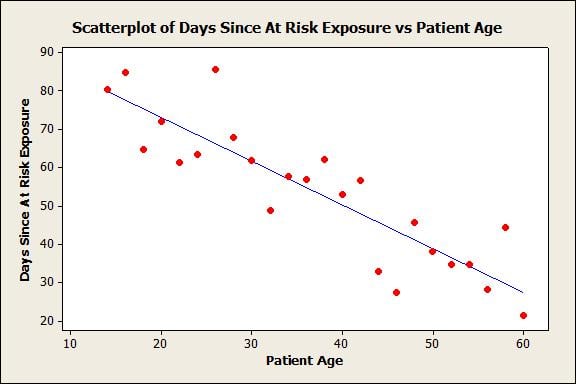
Older patients got tested faster … before the HIV antibodies were able to fully develop and show a positive test result.
Keep the idea that “correlation does not imply causation” in your mind when reading some of the many studies publicized in the media. Intentionally or not, the media frequently imply that a study has revealed some cause-and-effect relationship, even when the study's authors detail precisely the limitations of their research.
Statistical Mistake 4: Not Distinguishing Between Statistical Significance and Practical Significance
It's important to remember that using statistics, we can find a statistically significant difference that has no discernible effect in the "real world." In other words, just because a difference exists doesn't make the difference important. And you can waste a lot of time and money trying to "correct" a statistically significant difference that doesn't matter.
Let's say you love Tastee-O's cereal. The factory that makes them weighs every cereal box at the end of the filling line using an automated measuring system. Say that 18,000 boxes are filled per shift, with a target fill weight of 360 grams and a standard deviation of 2.5 grams.
Using statistics, the factory can detect a shift of 0.06 grams in the mean fill weight 90% of the time. But just because that 0.06 gram shift is statistically significant doesn't mean it's practically significant. A 0.06 gram difference probably amounts to two or three Tastee-O’s—not enough to make you, the customer, notice or care.
In most hypothesis tests, we know that the null hypothesis is not exactly true. In this case, we don’t expect the mean fill weight to be precisely 360 grams -- we are just trying to see if there is a meaningful difference. Instead of a hypothesis test, the cereal maker could use a confidence interval to see how large the difference might be and decide if action is needed.
Statistical Mistake 5: Stating That You've Proved the Null Hypothesis
 In a hypothesis test, you pose a null hypothesis (H0) and an alternative hypothesis (H1). Then you collect data, analyze it, and use statistics to assess whether or not the data support the alternative hypothesis. A p-value above 0.05 indicates “there is not enough evidence to conclude H1 at the .05 significance/alpha level”.
In other words, even if we do not have enough evidence in favor of the alternative hypothesis, the null hypothesis may or may not be true.
For example, we could flip a fair coin 3 times and test:
H0: Proportion of Heads = 0.40
H1: Proportion of Heads ≠ 0.40
In this case, we are guaranteed to get a p-value higher than 0.05. Therefore we cannot conclude H1. But not being able to conclude H1 doesn't prove that H0 is correct or true! This is why we say we "fail to reject" the null hypothesis, rather than we "accept" the null hypothesis.
Statistical Mistake 6: Not Seeking the Advice of an Expert
One final mistake we’ll cover here is not knowing when to seek the advice of a statistical expert. Sometimes, employees are placed in statistical training programs with the expectation that they will come out immediately as experienced statisticians. While this training is excellent for basic statistical projects, it’s usually not enough to handle more advanced issues that may come about. After all, most skilled statisticians have had 4-8 years of education in statistics and at least 10 years of real-world experience!
If you’re in need of some help, you can hire a Minitab statistician. Learn more about Minitab’s consulting service by visiting http://www.minitab.com/services/statistical-consulting/