


You know the drill…you’re in Six Sigma training and you’re learning how to conduct a design of experiment (DOE). Everything is making sense, and you’ve started thinking about how you’ll apply what you are learning to find the optimal settings of a machine on the factory floor. You’ve even got the DOE setup chosen and you know the factors you want to test …
Then … BAM! … You’re on your own and you immediately have issues analyzing the data. The design you’ve chosen might actually not be the best for the results you need. It's a classic case of learning something in theory that becomes much more challenging when applied in the real world.
Scott Sterbenz is a Six Sigma master black belt at Ford Motor Company and a technical advisor for the United States Bowling Congress, and he knows the above scenario all too well. As part of his job at Ford, he teaches Six Sigma to quality engineers, and he’s also performed many successful DOEs over the course of his career in the auto industry and with the U.S. Bowling Congress.
Scott shared a few tips with us for performing DOEs that he’s gathered from mentoring Six Sigma students and conducting DOE applications at Ford.
Get Creative with Your Response
Most training materials for designed experiments teach that the response for an experiment should be the key process output variable (KPOV) of the process, or selected from a C&E matrix or fishbone diagram during the ‘Define’ phase of the DMAIC methodology. Generally these guidelines are true, but sometimes they yield a non-meaningful measure. You want to be able to measure your responses quantitatively.
At Ford, one Six Sigma team was faced with correcting premature bulb failures. Warranty costs in certain models were increasing every year, and bulb failures were the single highest warranty cost for Ford. There was some disagreement about what was causing the bulb failures. Was it over-voltage, an issue with the vibration of the vehicle, or perhaps something to do with the quality of bulbs from the supplier?
The team set up a 25 full factorial DOE with the following factors: voltage input, vibration input, filament orientation angle, bulb supplier, and filament centering. What should the response be? The team brainstormed many responses, including average time to failure, variance in time to failure, signal-to-noise ratio. But was there something better?
By thinking outside of the box and getting creative with responses, the team ended up selecting reliability measures over the other responses they had brainstormed. They performed follow-up analysis in Minitab Statistical Software, and ended up with the insight they needed to address why premature bulb failures were occurring. Since implementing their solution in 2008, the team has saved Ford several million dollars.
Moral of the story: get creative with your responses!
The Response Needn’t Be Continuous Data
When a cosmetic problem with the vehicle’s carpet threatened the impending launch of the 2011 Fiesta, Ford’s Body Interior Six Sigma team saw a clear opportunity for quality improvement. Ford and the supplier were at odds over how to solve a defect that became known as ‘carpet brush marking.’

Sterbenz and the team began by working with the supplier to analyze the process used to manufacture the automotive carpet. They found that the settings of a machine called a needler were the likely cause of the diminished product quality. But the manufacturer worried that altering the needler’s settings also would affect the plushness of the carpet. The team needed to find process improvements that would eliminate brush marks while maintaining the plushness.
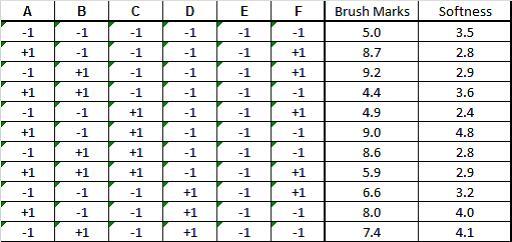
Using Minitab’s DOE tools, the Ford team created a fractional factorial design with center points that would give them the information they needed in only 34 runs. For each of the experimental runs, a team of evaluators compared the new product to the current carpet, and their ratings for softness and brush markings were averaged and analyzed.
The evaluators responses were collected as attribute data (from an ordinal Likert scale questionnaire). The team knew they needed continuous data – but how could they make these responses continuous? For this experiment, the team converted the units digit ordinal data to continuous data with tenths digit resolution by leveraging multiple evaluators and averaging:
Moral of the story: remember that your response needn’t be continuous data!
To read more about how Ford eliminated the carpet defect and successfully completed this DOE, check out the full case study: Launching a Flawless Fiesta: Ford Motor Company.
Also, if you’re headed to the 2013 ASQ World Conference in Indianapolis, be sure to attend Scott’s session, From Bulb Failures to Bowling: Making Sure Your Designed Experiments Succeed on Monday, May 6, 2013 at 1:30 p.m. in room 205. He’ll share more tips for performing successful DOEs, including the most common problems quality practitioners run into when setting up and analyzing data for a DOE.