


With more options, come more decisions.
With equivalence testing, you now have more statistical tools to test a sample mean against target value or another sample mean.
Equivalence testing is extensively used in the biomedical field. Pharmaceutical manufacturers often need to test whether the biological activity of a generic drug is equivalent to that of a brand name drug that has already been through the regulatory approval process.
But in the field of quality improvement, why might you want to use an equivalence test instead of a standard t-test?
Interpreting Hypothesis Tests: A Common Pitfall
Suppose a manufacturer finds a new supplier that offers a less expensive material that could be substituted for a costly material currently used in the production process. This new material is supposed to be just as good as the material currently used. It should not make the product too pliable nor too rigid.
To make sure the substitution doesn’t negatively impact quality, an analyst collects two random samples from the production process (which is stable): one using the new material and one using the current material.
The analyst then uses a standard 2-sample t-test (Stat > Basic Statistics > 2-Sample t in Minitab Statistical Software) to assess whether the mean pliability of the product is the same using both materials:
________________________________________
Two-Sample T-Test and CI: Current, New
Two-sample T for Current vs New
N Mean StDev SE Mean
Current 9 34.092 0.261 0.087
New 10 33.971 0.581 0.18
Difference = μ (Current) - μ (New)
Estimate for difference: 0.121
95% CI for difference: (-0.322, 0.564)
T-Test of difference = 0 (vs ≠): T-Value = 0.60 P-Value = 0.562 DF = 12
________________________________________
Because the p-value is not less than the alpha level (0.05), the analyst concludes that the means do not differ. Based on these results, the company switches suppliers for the material, confident that statistical analysis has proven that they can save money with the new material without compromising the quality of their product.
The test results make everyone happy. High-fives. Group hugs. Popping champagne corks. There’s only one minor problem.
Their statistical analysis didn’t really prove that the means are the same.
Consider Where to Place the Burden of Proof
In hypothesis testing, H1 is the alternative hypothesis that requires the burden of proof. Usually, the alternative hypothesis is what you’re hoping to prove or demonstrate. When you perform a standard 2-sample t-test, you’re really asking: “Do I have enough evidence to prove, beyond a reasonable doubt (your alpha level), that the population means are different?”
To do that, the hypotheses are set up as follows:
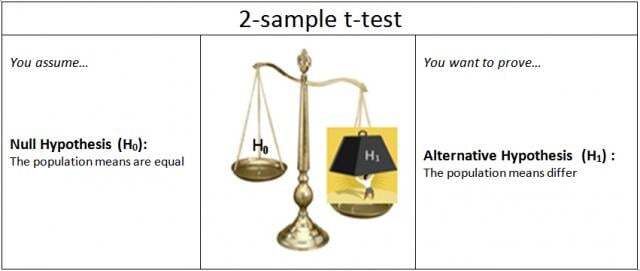
If the p-value is less than alpha, you conclude that the means significantly differ. But if the p-value is not less than alpha, you haven’t proven that the means are equal. You just don’t have enough evidence to prove that they’re not equal.
The absence of evidence for a statement is not proof of its converse. If you don’t have sufficient evidence to claim that A is true, you haven’t proven that A is false.
Equivalence tests were specifically developed to address this issue. In a 2-sample equivalence test, the null and alternative hypotheses are reversed from a standard 2-sample t test.
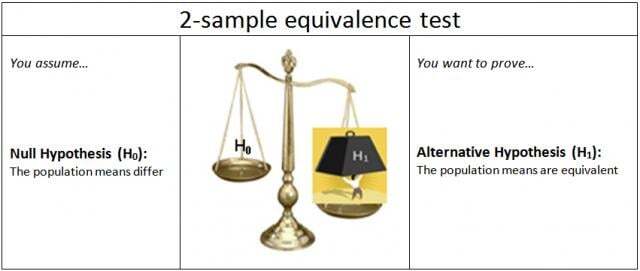
This switches the burden of proof for the test. It also reverses the ramification of incorrectly assuming (H0) for the test.
Case in Point: The Presumption of Innocence vs. Guilt
This rough analogy may help illustrate the concept.
In the court of law, the burden of proof rests on proving guilt. The suspect is presumed innocent (H0), until proven guilty (H1). In the news media, the burden of proof is often reversed: The suspect is presumed guilty (H0), until proven innocent (H1).
Shifting the burden of proof can yield different conclusions. That’s why the news media often express outrage when a suspect who is presumed to be guilty is let go because there was not sufficient evidence to prove the suspect’s guilt in the courtroom. As long as news media and the courtroom reverse their null and alternative hypotheses, they’ll sometimes draw different conclusions based on the same evidence.
Why do they set up their hypotheses differently in the first place? Because each seems to have a different idea of what’s a worse error to make. The judicial system believes the worse error is to convict an innocent person, rather than let a guilty person go free. The news media seem to believe the contrary. (Maybe because the presumption of guilt sells more papers than presumption of innocence?)
When the Burden of Proof Shifts, the Conclusion May Change
Back to our quality analyst in the first example. To avoid losing customers, the company would rather err by assuming that the quality was not the same using the cheaper material--when it actually was--than err by assuming it was the same, when it actually was not.
To more rigorously demonstrate that the means are the same, the analyst performs a 2-sample equivalence test (Stat > Equivalence Tests > Two Sample).
________________________________________
Equivalence Test: Mean(New) - Mean(Current)
Test
Null hypothesis: Difference ≤ -0.4 or Difference ≥ 0.4
Alternative hypothesis: -0.4 < Difference < 0.4
α level: 0.05
Null Hypothesis DF T-Value P-Value
Difference ≤ -0.4 12 1.3717 0.098
Difference ≥ 0.4 12 -2.5646 0.012
The greater of the two P-Values is 0.098. Cannot claim equivalence.
________________________________________
Using the equivalence test on the same data, the results now indicate that there isn't sufficient evidence to claim that the means are the same. The company cannot be confident that product quality will not suffer if they substitute the less expensive material. By using an equivalence test, the company has raised the bar for evaluating a possible shift in the process mean.
Note: If you look at the above output, you'll see another way that the equivalence test differs from a standard t-test. Two one-sided t-tests are used to test the null hypothesis. In addition, the test uses a zone of equivalence that defines what size difference between the means you consider to be practically insignificant. We’ll look at that in more detail in my next post.
Quick Summary
To choose between an equivalence test and a standard t-test, consider what you hope to prove or demonstrate. Whatever you hope to prove true should be set up as the alternative hypothesis for the test and require the burden of proof. Whatever you deem to be the less harmful incorrect assumption to make should be the null hypothesis. If you’re trying to rigorously prove that two means are equal, or that a mean equals a target value, you may want to use an equivalence test rather than a standard t-test.