


If you regularly perform regression analysis, you know that R2 is a statistic used to evaluate the fit of your model. You may even know the standard definition of R2: the percentage of variation in the response that is explained by the model.
Fair enough. With Minitab Statistical Software doing all the heavy lifting to calculate your R2 values, that may be all you ever need to know.
But if you’re like me, you like to crack things open to see what’s inside. Understanding the essential nature of a statistic helps you demystify it and interpret it more accurately.
R-squared: Where Geometry Meets Statistics
So where does this mysterious R-squared value come from? To find the formula in Minitab, choose Help > Methods and Formulas. Click General statistics > Regression > Regression > R-sq.
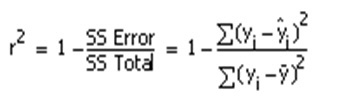
Some spooky, wacky-looking symbols in there. Statisticians use those to make your knees knock together.
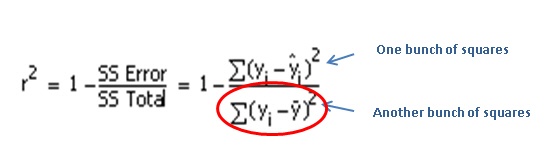
But all the formula really says is: “R-squared is a bunch of squares added together, divided by another bunch of squares added together, subtracted from 1.“

What bunch of squares, you ask?

No, not them.
SS Total: Total Sum of Squares
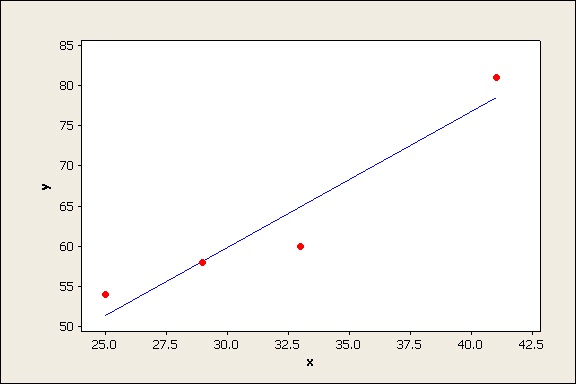
First consider the "bunch of squares" on the bottom of the fraction. Suppose your data is shown on the scatterplot below:
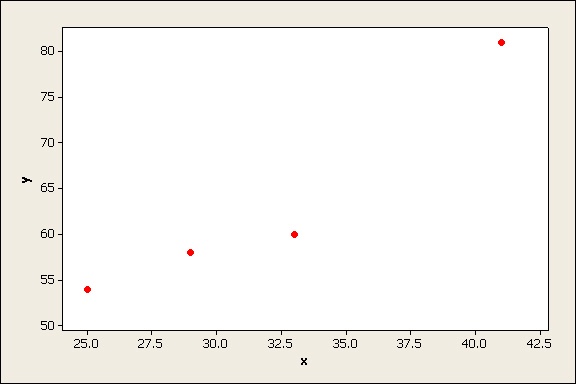
(Only 4 data values are shown to keep the example simple. Hopefully you have more data than this for your actual regression analysis! )
Now suppose you add a line to show the mean (average) of all your data points:
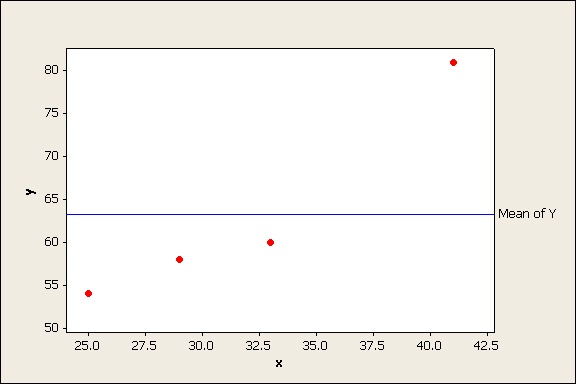
The line y = mean of Y is sometimes referred to the “trivial model” because it doesn’t contain any predictor (X) variables, just a constant. How well would this line model your data points?
One way to quantify this is to measure the vertical distance from the line to each data point. That tells you how much the line “misses” each data point. This distance can be used to construct the sides of a square on each data point.
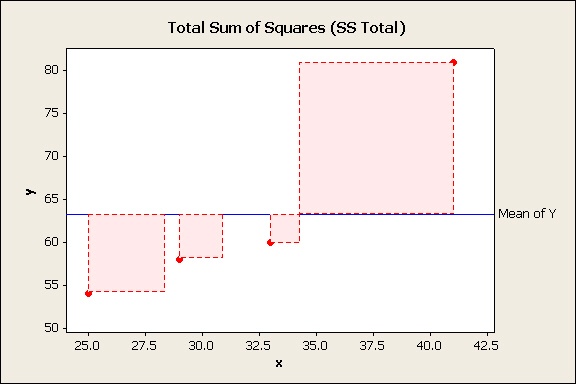
If you add up the pink areas of all those squares for all your data points you get the total sum of squares (SS Total), the bottom of the fraction.
SS Error: Error Sum of Squares
Now consider the model you obtain using regression analysis.
Again, quantify the "errors" of this model by measuring the vertical distance of each data value from the regression line and squaring it.
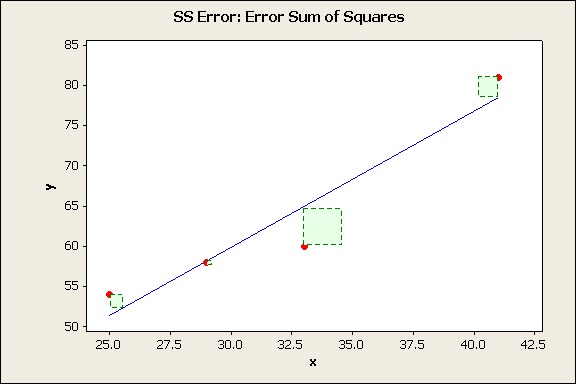
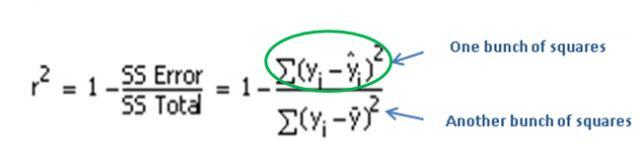
If you add the green areas of theses squares you get the SS Error, the top of the fraction.
So R2 basically just compares the errors of your regression model to the errors you’d have if you just used the mean of Y to model your data.
R-Squared for Visual Thinkers
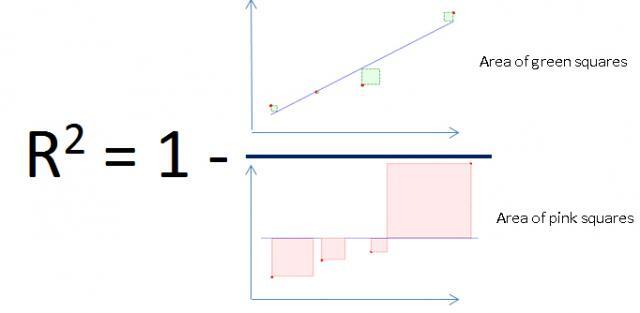
The smaller the errors in your regression model (the green squares) in relation to the errors in the model based on only the mean (pink squares), the closer the fraction is to 0, and the closer R2 is to 1 (100%).
That’s the case shown here. The green squares are much smaller than the pink squares. So the R2 for the regression line is 91.4%.
But if the errors in your reqression model are about the same size as the errors in the trivial model that uses only the mean, the areas of the pink squares and the green squares will be similar, making the fraction close to 1, and the R2 close to 0.
That means that your model, isn't producing a "tight fit" for your data, generally speaking. You’re getting about the same size errors you’d get if you simply used the mean to describe all your data points!
R-squared in Practice
Now you know exactly what R2 is. People have different opinions about how critical the R-squared value is in regression analysis. My view? No single statistic ever tells the whole story about your data. But that doesn't invalidate the statistic. It's always a good idea to evaluate your data using a variety of statistics. Then interpret the composite results based on the context and objectives of your specific application. If you understand how a statistic is actually calculated, you'll better understand its strengths and limitations.
Related link
Want to see how another commonly used analysis, the t-test, really works? Read this post to learn how the t-test measures the "signal" to the "noise" in your data.