


When someone gives you data to analyze, you can gauge how your life is going by what you've received. Get a Minitab file, or even comma-separated values, and everything feels fine. Get a PDF file, and you start to think maybe you’re cursed because of your no-good-dirty-rotten-pig-stealing-great-great-grandfather and wish that you were someone else. For those of you who might be in such dire straits today, here are 3 helpful things you can do in Minitab Statistical Software: change data type, code and remove missing values, and recode variables.
For the purposes of having an example, I’m going to use some data from the Centers for Medicare and Medicaid Services. The data are from October 2008 to September 2009 and track the quality of a hospital’s response to a patient with pneumonia. The data in the PDF file look like this:
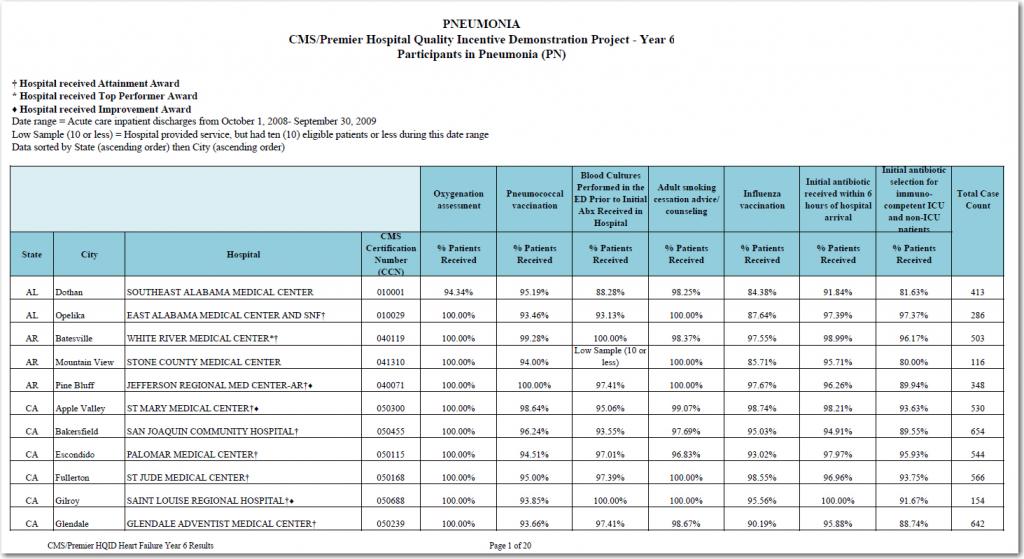
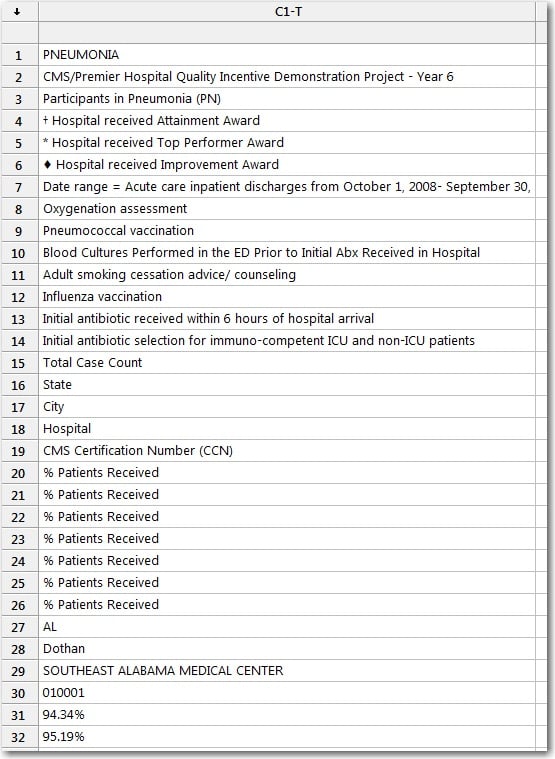
If you copy and paste it into Minitab, hoping for nicely-organized tables as appear in the document, you get a single column that contains everything:
Don’t despair. Instead, look at the capabilities that are at your fingertips.
Change Data Type
What we’re really after for analysis are the numbers inside the table, so a good first step is to get the numbers.
- Choose Data > Change Data Type > Text to Numeric.
- In Change text columns, enter C1.
- In Store Numeric Columns in, enter C2.
- Click OK. In the Error box, click Cancel.
When you look at the worksheet, the cells that had text values after the paste are now missing value symbols and the numbers that were in the tables remain. You might be a bit unnerved that the percentages of patients who received treatments are all 1, but that’s only a result of the column formatting. (Want to see? Change the numeric display format.)
Remove missing values
You can easily get rid of the missing values in these data so that the missing values don’t interfere with further analysis, but there’s an additional complication here. While most of the missing values are column headers that we don’t want in the data, the table itself contains some missing values. Anytime a hospital gave a treatment to fewer than 10 patients, the table contains the value “Low Sample (10 or less).” To preserve these missing values while eliminating the others, we want to use different values to represent the different cases in the data.
- Choose Calc > Calculator.
- In Store Result in Variable, enter C3.
- In Expression, enter If(Left(C1,3)=”Low”, 99999999, C2).
- Click OK.
Now that you have two kinds of missing value, you can start cleaning them up. First, get rid of the ones that don’t represent values in the table.
- Choose Data > Copy > Columns to Columns.
- In Copy from columns, enter C3.
- In Store Copied Data in Columns, select In current worksheet, in columns and enter C4.
- Click Subset the Data.
- In Specify Which Rows to Include, select Rows that match and click Condition.
- In Condition, enter C3 <> '*'.
- Click OK in all of the dialog boxes.
Now that we’ve gotten rid of the missing values that weren’t numbers in the table, we can change the missing values that we kept back to a form Minitab recognizes.
- Choose Calc > Calculator.
- In Store result in variable, enter C5.
- In Expression, enter If(c4 = 99999999, ‘*’, c4).
- Click OK.
Recode the data
For analysis, we want one row for each hospital. To do this, we’ll create a table in the worksheet that shows how to identify the variables for analysis, then unstack the variables.
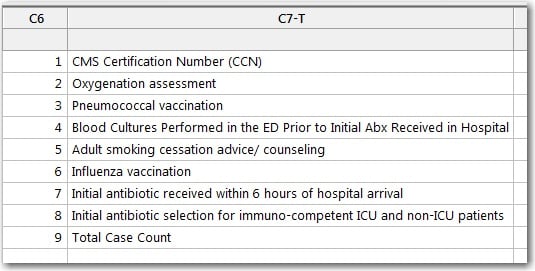
Because we kept the missing values from the table, every hospital has 9 variables. We make a table in the worksheet that shows the numbers 1 to 9 and a name for each variable:
To associate the variable names with all 1,944 rows of data, we’ll make patterned data.
- Choose Calc > Make Patterned Data > Simple Set of Numbers.
- In Store patterned data in, enter C8.
- In From first value, enter 1.
- In To last value, enter 9.
- In Number of times to list sequence, enter 216.
- Click OK.
To convert the number codes to the text variable descriptions, we’ll recode the data.
- Choose Data > Code > Use Conversion Table.
- In Code values in the following column, enter C8.
- In Current values, enter C6.
- In Coded values, enter C7.
- Click OK.
Now that you have a column that says which number belongs to each variable, unstack the data.
- Choose Data > Unstack Columns.
- In Unstack the data in, enter C5.
- In Using subscripts in, enter C9.
- Click OK.
Now, you have a new worksheet where each hospital is identified by its unique CCN and the variables are the proportions of pneumonia patients who got each treatment from that hospital.
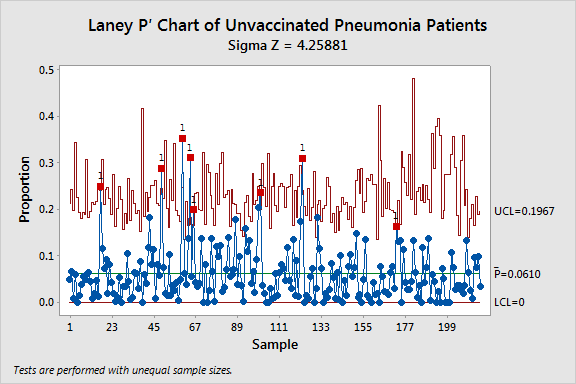
Once the data are in a traditional format for analysis, you can start to get the answers that you want quickly. For example a Laney P’ chart might suggest whether some hospitals had a higher proportion of unvaccinated pneumonia patients than you would expect from the variation in the data.
Fortunately, being able to change data types, remove missing values, and recode data lets you get data ready to analyze in Minitab as fast as possible. That way, you’re ready to give the answers that your fearless data analysis justifies.