


Last time I used design of experiments to look at the gummi bear data, I interpreted the center point data. The data say that I won’t need any square or cubic terms to get a good fit to the data. Traditionally, the next effect to look at in design of experiments is the block effect.
I was worried that there would be a wearout effect acting on my catapult, so I changed popsicle sticks and rubber bands periodically. I also simply didn’t have time to collect all of my data at the same time, so the blocks represent different days. Moreover, I collected the data for the third block in a different location. Any of these sources of variation—and sources I can’t think of, too—could make it harder to see the effect of the factors that I care about.
This is what the block term looks like in the ANOVA table:

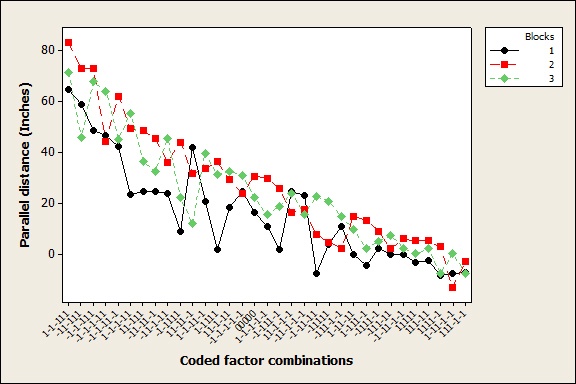
A line plot in Minitab Statistical Software illustrates what happened. The bears in block 1 went shorter distances, on average. The bears in block 2 went longer distances, on average. There is a lot of random variation present, too. Even though the gummi bears in the second block went the furthest on average, there were some factor combinations for which the gummi bears from the second block went the shortest distance.
Interestingly enough, that’s almost the end of the story from a practical standpoint in design of experiments. Including the blocks in our data collection means that we can account for them when we examine the other factors for statistical significance. The average differences between the blocks won’t interfere with the other effects. To illustrate, let’s take a brief look at some residual plots.
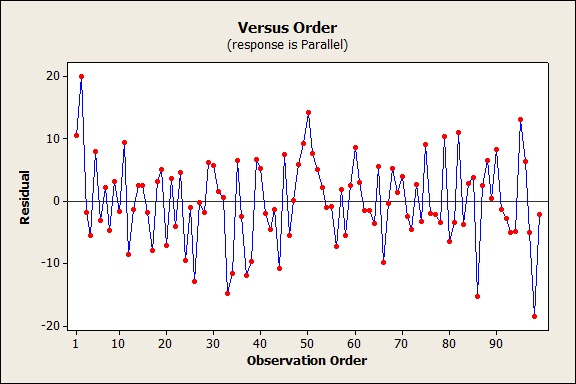
The big thing about residual plots is that they’re not supposed to have patterns in them. Below is the residual plot with blocks. This plot looks like we’d like it to look.
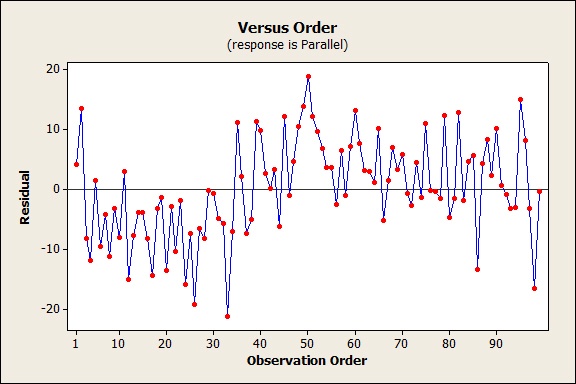
Now let's look at the residual plot without blocks. If we didn’t have the blocks, we wouldn’t be moving on to a discussion of how the position of the fulcrum affects the parallel distance. We’d be wondering what the heck happened in the data collection that every single residual was negative from the 12th through the 34th observations. We’d be wondering what went wrong and whether we could trust any of the data.
Be careful about trying to learn more from block differences than the data allow. We don’t really know why the blocks are different. Was the floor in one location so soft that depressing the catapult changed the launch angle? Did changing popsicle sticks matter more than changing the rubber band? We don’t have data on these questions.
The big thing to remember about blocks when we do design of experiments is to use them if you can’t collect all of your data under the same conditions.
Not done with DOE for the day? Check out Bobcat Company’s million-dollar experiment.