


by Matthew Barsalou, guest blogger
Process capability analysis using Minitab Statistical Software’s Capability SixpackTM can be taught using a catapult. A process capability analysis is performed to determine if a process is statistically capable.
In my last blog post, I collected data from a first run of catapult results and found that the run not only had a large amount of variability, it also violated the assumption of normality. Now it's time to do a second run.
The Second Run and Capability Analysis
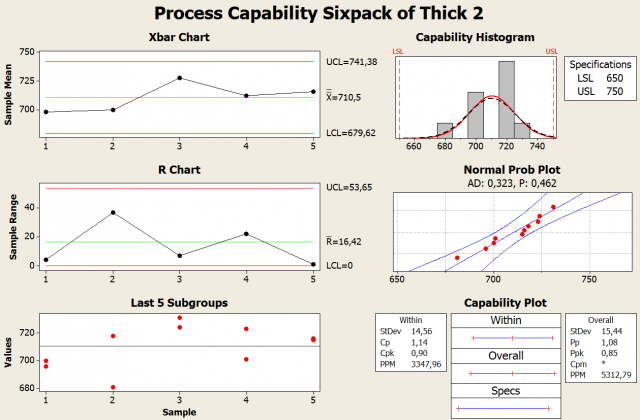
A second run was performed using thicker and more robust wire to stretch the rubber band; this wire did not have the variation that the first one did, so it simulates a process improvement that should reduce variability. The results are depicted in the Capability Sixpack below. The Xbar chart for this run shows the UCL is below the USL; unfortunately, the LCL is still below the LSL. All shots landed within the specification limits; however, the capability histogram indicates the normal distribution for this run is wider than the specification limits.
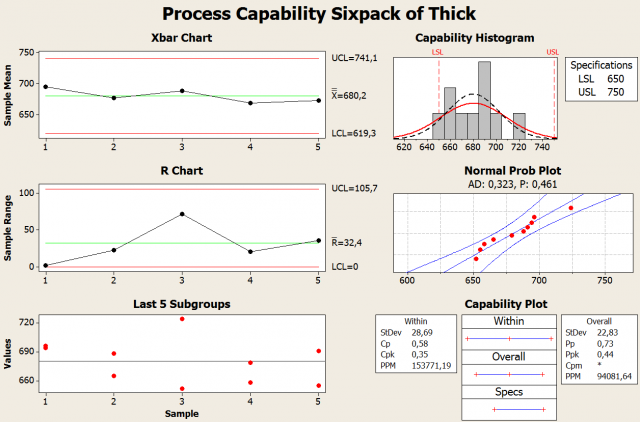
The normal probability plot has a P value of 0.461 so we fail to reject the null hypothesis, which we stated as “data fits the normal distribution.” The first run appears to have had special cause variation; this could have been the result of using a wire that was heavily distorted. The normal probability plot indicates the data fits the assumption of normality so we move on to the capability plot.
Differences Between Within and Overall Indices in a Capability Analysis
There are results for “within” and “overall” indices. The difference between within and overall is the way in which the process variation is estimated. Within variation is based on the Statistical Process Control Manual and uses only common cause variation in subgroups in the calculation and overall variation includes both common cause and special cause variation for the entire set of data from the process study. Common cause variation results “from the system” and special cause variation results from an “assignable cause.” The manipulation of the weak wire would be an example of a special cause.
The within indices are the capability indices Cp and Cpk and they can be thought of as what the process is capable of producing. The overall indices are Pp and Ppk and they are the processes’ actual performance with the possible presence of variation due to special cause.
A Cp is a process capability index used to determine if a process is capable of meeting a specification. It is determined by dividing the tolerance range by six times the standard deviation.
Ideally, a Cp should be 1.33 or greater as this would mean the spread of the data is only 75% of the tolerance range; this leaves room for slight variations in the process without generating out-of-specification parts. However, the Cp index does not tell us if the process would produce parts that are within specification. A process could have a Cp of 2.00 due to very little variation, but still be producing out of specification parts because the process mean is at the edge of a specification limit.
A more complete picture is provided by also using the Cpk index, which is based on two calculations. The first calculation is USL minus the process mean divided by three times the process standard deviation, and the second calculation is the process mean minus LSL divided by three times the process standard deviation.
The lower of the two results is used to identify the process capability in regards to the centering of the process in comparison to the specification limits. Like Cp, a Cpk should generally be 1.33 or greater.
The formulas for Pp and Ppk are somewhat similar to the Cp and Cpk formulas; however, calculations for Pp and Ppk use the process variation in place of the standard deviation.
The Minitab Capability Sixpack results for the second run indicate a Pp of 0.73 and a Ppk of 0.44, and this is much lower than the ideal of 1.33. Minitab has determined the process would result in a parts per million (PPM) of 94,081.64. This means that over 94,000 out-of-specification catapult shots can be expected for every 1,000,000 shots. This corresponds to a defect rate of 9.4%.
Although none of the 10 shots we made were out of specification, the process is still not capable and needs improvement.
The Third Run and Process Capability Analysis
The means of the previous run were spread around a mean of 680 cm so the catapult process was adjusted by moving the catapult 20 centimeters closer to the target area. We then fired 10 shots and analyzed the new data. The results show an improvement as depicted in figure 3. The Xbar control limits are now within the range of the specification limits and both Pp and Ppk have improved. The PPMs indicate a defect rate of only 0.5%; this is an improvement, but still not acceptable for ensuring a product that conforms to specification in a mass-production environment. A manufacturing company with a Pp of 1.08 and a production run of 10,000 units should anticipate 50 units out of specification. The catapult process needs further improvements to reduce variation; fortunately, there are quality tools available to help with this.
If you want to build your own catapult for learning capability analysis, here are my plans and instructions for the DIY DOE Catapult in a PDF document.