


by Cory Heid, guest blogger
Almost all of us have tried a Tootsie Pop at some point. I’m willing to bet that most of us also thought, “I wonder how many licks it does take to get to the center of the Tootsie Pop?” If you haven’t wondered about this, here’s the classic commercial that may get you more curious:
Personally, I was not very satisfied with the owl's answer of “3,” so I decided to continue the little boy’s quest to find the number of licks required to reach the center of a Tootsie Pop.
Research
Looking around the ‘net, I found that other studies done by student researchers at various universities have reached very different answers. These students, who represented some significant research institutions and engineering schools, used different licking methodologies and/or licking machines and licking experiments. As I mentioned, the results varied greatly. See for yourself:
|
Licking Machines: Purdue University -364 licks University of Michigan – 411 licks Harvard University – 2255 licks |
Licking Experiments: Purdue University – 252 licks Swarthmore College – 144 licks University of Cambridge – 3481 licks |
Since I lacked both the equipment and desire to build a licking machine, a simpler licking experiment seemed appropriate. I wanted to assess which of these factors would have the most impact on the effectiveness of the Tootsie-Pop licking:
- Force of the lick
- Temperature of the licker's mouth
- pH Level of the licker's saliva
- Solubility of the licker's saliva
Lab Work
Once I selected my factors, I incorporated them into an experiment. I chose simulate the different levels of each factor in the lab. For my force simulation, I placed my Tootsie Pop in a beaker with 150 mL of water and a magnetic stirrer. I placed the beaker on a hot plate that could spin the stirrer and create a circular motion in the water. I then pulled the Tootsie Pop out of the water every minute and measured the height and width of the pop on the thicker band around the pop. I did this each minute until the pop revealed a noticeable amount of chocolate (the elusive ‘center’).
This method had some issues. The chocolate-flavored Tootsie Pops made the water very murky, so I omitted them from the lab testing. I also could not track the speed of the circulating water. Instead, I used the speed dial’s indicator on the magnetic stirrer (1 being slowest speed, 10 being fastest speed). After several tests at speeds 1, 2, 4 and 6, I was able to gather an ample amount of data to perform some analysis.
I then moved on to the temperature tests. Like the force tests, these used a beaker, 150 mL of water, and a hot plate. I heated the water to different temperatures and measured the height and width of the Tootsie Pop every minute until reaching the center.
The next test involved pH. I used a beaker, and 150 mL of water as the basis of my tests. I added a small amount of either baking soda (to make the solution more basic) or vinegar (to make the solution more acidic). I then recorded and measured the height and width of the pop at regular intervals.
My final test, for solubility, consisted of putting the Tootsie Pop in a very large container containing a gallon of water. I dipped the pop in the water for one minute and took height and width measurements. In addition, I stirred the water to make sure it was diluted as possible and evenly distributed. My goal was to have enough data to analyze to help determine important factors in Tootsie Pop decay.
Time to Analyze the Data!
I organized the collected data by the four factors: Force, Temperature, pH and Solubility. I wanted to look at the difference of the decay amounts for height and width during each minute or time period that I recorded. I first ran some One-Way ANOVA’s on the various factors. Below is the ANOVA I ran for Temperature. I used 3 temps: 56 C, 62 C, and 39 C respectively.
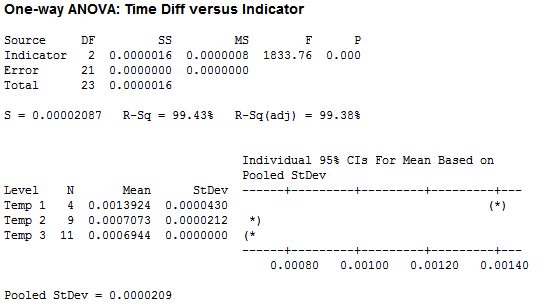
While it does appear that there is a significant difference between temperature tests, the data for Temp 1 was taken at a temperature of 56 C (way above normal body temperature) and the measurements were taken about two minutes apart, instead of the standard one minute. My conclusion here is that temperature in the range of body temperatures really does not have an effect on ‘the number of licks.’ Unless you have a significant fever, in which case you might not be interested in a Tootsie Pop anyway.
For pH, I used acidic, basic, neutral and solubility (large amounts of liquid):
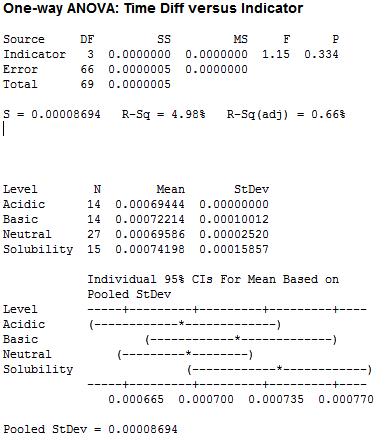
Clearly we have no significant difference between the pH tests, leading me to believe that the pH of our saliva should not factor into the number of licks.
For speed, I used the variable knob on my stir plate, using speeds 1, 2, 4 and 6, and grouped my results based on the speed setting:
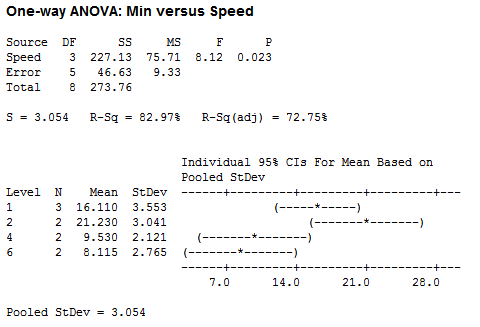
After doing an ANOVA on the total time it takes to reach the center and the corresponding speed, there appears to be a significant difference. But it should be noted that the pops used for speed 2 were incredibly perfect -- maybe the most perfect Tootsie Pops ever in both candy shape and Tootsie center location. Hence, this difference may have been due not to speed, but rather to a greater distance to the center.
Human Lickers
Seeing that the different variables of pH, temp and force probably do not have much of an effect on the dissolving of a Tootsie Pop, human lickers were brought in test this finding. I determined a list of possible other factors that could affect the number of licks to the center – such as force, temp pH, height, weight, gender, and the questions -- ‘Have you been chewing anything in the last half hour?’, ‘Have you had anything to drink in the last half hour?’ The beginning diameter of the Pop and the number of licks to the center were also recorded to track the number of licks. The center was also defined as ‘tasting chocolate.’ After 92 lickers reached the center, I found the following:
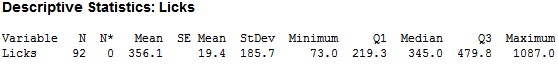
As you can see, there is large variability in the number of licks. After cleaning for incomplete data (missing height, weight…etc.), I was able to trim the observations down to 70, which looked like this:
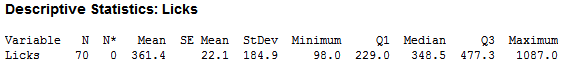
Even after the cleaning the data, there was not much difference. I concluded that the variability was not so much in the human lickers, but within the pop itself. Most pops would look something like that on the right, while the pop on the left would be considered a ‘Perfect Pop’:
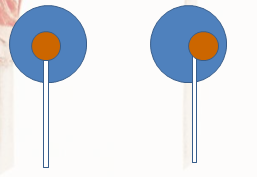
Given slight offsets of the center, the side you choose would affect the number of licks. Overall, the number of licks I gathered does fit in the middle of the number of licks other researchers gathered, so I feel confident that my data collection was a success.
About the Guest Blogger:
Cory Heid is a student in applied mathematics at Siena Heights University in Adrian, Mich. He is interested in data analysis projects, as well as data-driven model building. Cory presented his Tootsie Pop findings at the 2013 Joint Mathematics Meetings in January, and at the Michigan Undergraduate Mathematics Conference in February.