by Erwin Gijzen, Guest Blogger
People who work in quality improvement know that the root causes of quality issues are hard to find. A typical production process can contain hundreds of potential causes. Additionally, companies often produce products with multiple quality requirements, such as dimensions, surface appearance, and impact resistance.
With so many variables, it’s no wonder many companies struggle with quality variation. When a process results in an out-of-specification product, companies rely on engineers to stabilize the quality of their products by finding and reducing the root causes. But what’s the most effective way to accomplish this?
Luckily, manufacturers usually record lots of data (such as batch numbers, people involved, production lines, equipment settings, and equipment read-out values) that may be analyzed so we can understand where variation is coming from. In this two-part post, I’ll show you how to stabilize quality and reduce out-of-spec products using ANCOVA, or Analysis of Covariance. The first thing we need to do, however, is use data analysis to understand how our process is performing.
Process Capability
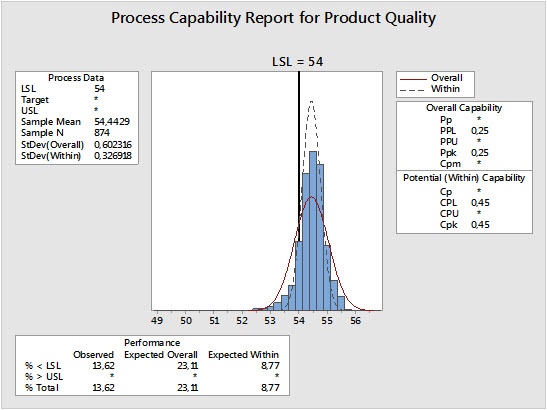
One of the key statistical tools used to assess and maintain quality is capability analysis. The results of this analysis reveal how capable a process is of making a product that meets specifications, and provide insight into whether and how processes need to be improved.

In the process profiled in the capability analysis displayed above, the out-of-spec level is about 13.6%. One strategy for reducing this number is shifting the mean of the data to the right. If that’s not possible, we can try to reduce the amount of variation in the process.
Identifying Causes
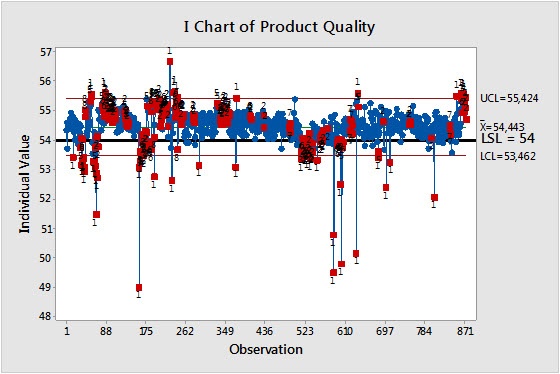
Control charts highlight process variability and help us determine whether the variation we see is just a natural part of the process, or if it’s due to special causes that we can do something about.
The control chart below, created from the same data used for the capability analysis, shows that this process is out of control. The red dots show either individual points that deviate far from the process average, or times when the process mean has shifted significantly.

When dates and times that correspond with variation are linked to process records, it’s possible to find a root cause, investigate it, and avoid it in the future. But the complex nature of a process and the frequent lack of clear process records can make this difficult.
In most processes, multiple variables change simultaneously, which makes finding a root cause difficult. One could easily find 10 or more possible causes without clearly identifying which one brought about the change in quality.
ANOVA and ANCOVA
Looking at the data for all factors together instead of individually can help avoid this obstacle. That’s where ANCOVA, or Analysis of Covariance, comes in.
ANOVA (Analysis of Variance) tests for significant differences between means in a group by comparing variances among categorical variables. When continuous variables are defined within ANOVA and included in the analysis, they are called “covariates.”
Covariance is the measure of the linear association between two variables, or how much they change together. Thus, ANCOVA is a general linear model that evaluates the covariates by blending ANOVA with regression analysis.
In part 2, we’ll use ANCOVA to analyze a real-world data set, highlight the defects, and determine the significance of their possible causes.
About the Guest Blogger:
Erwin Gijzen, MSc, is a chemical engineer with over 20 years’ experience in process improvement in the chemical, pharmaceutical, and food industries. As owner and senior consultant of Quality Target in the Netherlands, he assists companies in developing products and processes.


