


by Matthew Barsalou, guest blogger
I recently moved, and right after finishing the less-than-joyous task of unpacking I decided to take and break and relax by playing with Minitab Statistical Software.
As a data source I used the many quotes I received from moving companies. I'd invited many companies to look around my previous home, and then they would provide me an estimate with the price in Euros as well as an estimate on the amount of goods that would need to be transported. The "amount of goods" estimate was given in boxes. I don’t know what size boxes where referred to, but all the moving companies used boxes as a standard estimate of cubic area.
I had planned on using 35 boxes; most companies told me it would be 110-120 boxes. Since I was not even finished packing books when I had used up the first 50 boxes, I think I can safely assume the movers proved to be generally better at estimating shipping volume than I am.
Using Regression to Predict the Cost of Moving
Let’s suppose I wanted to determine the regression line for the cost of moving and the number of boxes that need to be moved. I rounded the estimates to the nearest 25 and changed the moving company names. Below is a data table with the estimates I received for cost and amount of goods:
|
Moving Company |
Cost Estimate (in Euro) |
Material Estimate (in Boxes) |
|
Company A |
1700 |
115 |
|
Company B |
1850 |
120 |
|
Company C |
3400 |
145 |
|
Company D |
1650 |
80 |
|
Company E |
1675 |
90 |
|
Company F |
2000 |
110 |
|
Company G |
1950 |
115 |
I was a bit suspicious of the estimate from Company C. The young man who gave me that estimate may not have even been born at a time when many of the other estimators where already working in the moving industry, so I wondered about his experience. Had the estimate been different, it may not have stood out, but his estimates were far higher than the others. Part of the reason this estimate was so high may be because he included extra costs for using conveyor outside my window as a labor-saving device.
I would be happy to pay for a labor-saving device that lowers my overall costs, but I was not so happy with extra costs for an expensive labor saving device that actually raised the overall expense.
A Quick Visual Check of the Data
I suspected Company C was an outlier, so to get a quick look at the situation I entered my data into a Minitab worksheet and created a scatterplot:
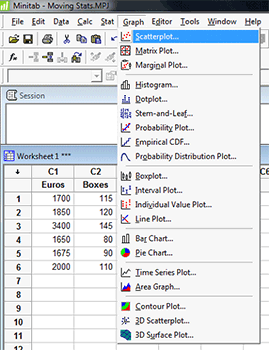
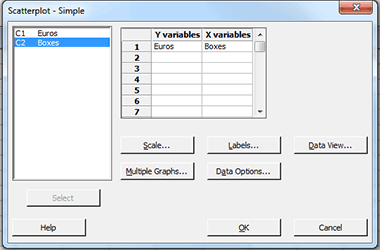
In the dialog box, I then selected worksheet column C1 Euros as the Y variable and worksheet column C2 Boxes as the X variable.
The resulting scatter plot is shown below. The red dot in the upper right hand corner is the result for Company C.
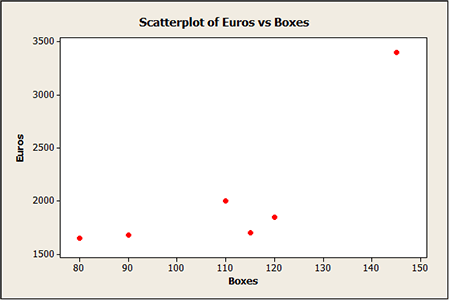
I am generally hesitant to discard potential outliers because I may be inadvertently throwing away valuable data, but in this case I decided that the estimates from Company C were just wrong and could throw off my regression model. Therefore, I removed them from the data set.
Creating the Regression Model
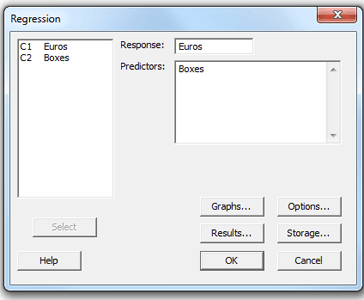
I then went to Stat > Regression > Regression… as depicted:
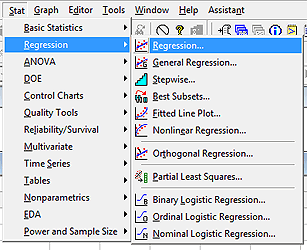
In the dialog box, I selected worksheet column C1 euros as the Response and worksheet column C2 Boxes as the predictor.
Minitab produced the following output:
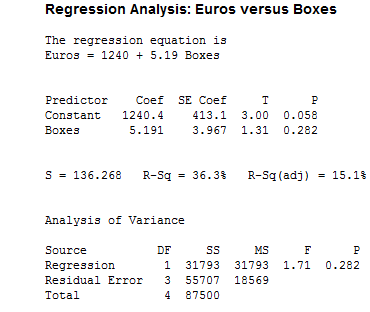
The regression equation is
Euros = 1,240 + 5.19 Boxes
This means the cost in Euros is equal to 1,240 plus 5.19 times the number of boxes. Using the resulting regression equation I can calculate the cost in Euro for any given number of boxes. For example, 100 boxes should cost: 1,240 + 5.19 x (100) = 1,759 Euro.
Cautions about Prediction with Regression Models
There are some things to keep in mind when performing regression. This is a statistical calculation based on the available data. If my data set (the moving companies) is not be as inclusive as I think it is, the next moving company I contact may not match my sample. For example, two movers with an almost-falling-apart truck would generally charge much less than a luxury moving company that offers far more than just a transportation service.
We also need to be aware of the hazards of extrapolating beyond the data set. Suppose I bought an entire library full of books on statistics. I now have 400 boxes to transport and may be able to get a discount from a moving company that is happy to have such a large, but easy contract. The move may take a few trucks, but pre-packed books are faster to move than boxes full of fine china or large furniture items that need to be disassembled, and the price estimate would reflect this.
I am rather certain that this regression model will fall apart on the low side. The cost should go down as the number of boxes to transport is decreased; however, contrary to what the regression model may indicate, I find it improbable that a moving company would give the same proportional rate to transport just one box. According to the regression model the cost for just one box is: 1,240 + 5.19 x (1) = 1,245.19 Euro. There is far less labor involved in the transport of only one box. The moving company does not need to supply a driver and four people for carrying boxes, so the estimate may actually be much lower.
Thinking Outside the Model
Unfortunately, Minitab can’t tell us that the biggest expense in the transportation of one box would be the moving trucks’ fuel, so a moving company is not the type of company to use when transporting only one box! This is an example of why process knowledge is so important: if you didn't know alternative types of transport were available, you wouldn't know the moving company was a poor choice for shipping one box!
Who knows, maybe some day Minitab will be able to do the all of the thinking for us! For now, whether calculating a regression model for costs/boxes or sales price/units, some knowledge of statistics and its limitations is still needed. Regression is an excellent way to make predictions and Minitab makes this easier; but it does not remove the need to have an understanding of the statistics being used.
Moving box image by Hsing Wei, used under Creative Commons 2.0 license.