


by Arun Kumar, guest blogger
One of the most commonly used statistical methods is ANOVA, short for “Analysis of Variance.” Whether you’re analysing data for Six-Sigma styled quality improvement projects, or perhaps just taking your first statistics course, a good understanding of how this technique works is important.
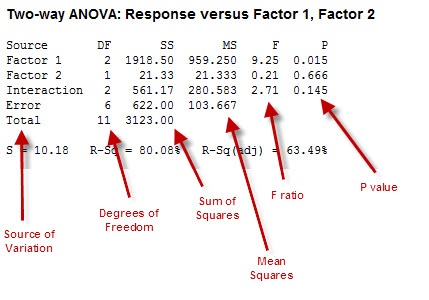
A lot of concepts are involved in any analysis using ANOVA and its subsequent interpretation. You’re going to have to grapple with terms such as Sources of Variation, Sum of Squares, Mean Squares, Degrees of Freedom, and F-ratio—and you’ll need to understand what statistical significance means.
The table below shows a typical ANOVA table, with call-outs to label each of the columns. This is the kind of output you’ll see when you perform ANOVA in statistical software such as Minitab.
 I’ve found an analogy from the field of Management Accounting to be very helpful in understanding ANOVA. And while we don’t all do accounting for businesses, we do all have personal budgets we need to keep track of. Therefore, rather than thinking about an organisation’s expenses in this example, let’s instead use your household’s monthly expenses as the basis of discussion.
ANOVA Is About Variation
Remember that everything has variation—whether it’s the parts coming off an assembly line, a chemical process, the weather each day...or the amount of your expenses from month to month.
The whole purpose of Analysis of Variance is to break up the variation into component parts, and then look at their significance. But there's a catch: in statistics, Variance (the square of Standard Deviation) is not an “additive” quantity—in other words, you can’t just add the variance of two subsets and use the total as the variance of the combination.
That’s why we need to look at Sums of Squares (SS), which are additive in nature. What ANOVA therefore involves is looking at the Sum of Squares for the total data, and then breaking that up into a number of component parts, including Sum of Squares due to “error.”
This is akin to breaking your total monthly household expenses into categories such as clothing, entertainment, education, travel, etc.
Thinking of "Error" as "Miscellaneous" Variation
Typically, our budgets also include a “miscellaneous” for expenses that happen, but aren’t readily identifiable or easily classified. This is the same thing as “Error” in the ANOVA table: it’s a place to capture variation that isn’t explicitly accounted for in our data.
In terms of our budgets, doing this helps us look at two things:
1. How big is a given expense in relation to Total expenses?
2. How does any particular expense compare with the Miscellaneous category?
In ANOVA, we call the collection of factors we’re using to assess variation a “model.” A good model ensures that the Sum of Squares due to error (a la “Miscellaneous” household expenses) is relatively small compared to that due to the factors in our model. This is why the Sum of Squares attributed to the model factors is called Explained Variation and the Sum of Squares due to error is called the Unexplained Variation.
Accounting for Variation
Good accounting in households requires the explained to be more than the unexplained. In ANOVA, the F-ratio is the tool we use to compare each of the sources of variation. However, getting the F-ratio requires a bit of adjustment to the Sum of Squares...we need to consider the Degrees of Freedom for each factor, which is akin to assigning weights to your household expense items. The Sum of Squares adjusted for—that is, divided by—the Degrees of Freedom is the statistical term we call Mean Square (MS).
The F-ratio is the MS for a factor divided by the MS for error. So, in the example above where the MS for Factor 1 is 959.25 and the MS for Error is 103.667, the F-ratio is:
F-ratio = MS (Factor 1) / MS (Error) = 959.25/103.667 = 9.25
In general, the higher the F-ratio—the ratio of the variation due to any component to the variation due to error—the more significant the factor is. In our budget analogy, these factors would be our more significant the household expense categories.
Balancing the Account
Ultimately, the value of budgeting is to give you an overall understanding of where your money is going. The value of ANOVA is to give you an overall understanding of where the variation you observe is coming from.
First, we need to decide how "expensive" a category must be in order to be considered importance. In statistics, we call this "alpha." The value of alpha (level of significance of the analysis/ test – typically 5%, or 0.05) represents the concept of materiality in our household example.
Then we need to figure out if each factor meets that standard of importance, or "significance." For that, we look at the p-value. The p-value which is the probability of getting the observed F-value if the variance between factors is equal. To determine significance, compare the p-value for each factor with the alpha value (0.05). If the p-value is less than alpha, that factor is significant, because there's less than a 5% chance we'd see that factor's F value otherwise. If the p-value is greater than alpha, we reject the factor's significance.
A final component of the ANOVA output to consider is R-squared. The R-squared statistic is simply the percentage of variation that can be explained by the factors included in our model. The greater the significance of the factors we can find through analysis, the greater the R-squared value (which is really a reflection of a good model).
And what good household manager would not want to account for as much budget variation as possible?
About the Guest Blogger:
Arun Kumar is based in the United Kingdom and has been a Master Black Belt at Xchanging plc for 9 years. He can be contacted at arunkumar1976@gmail.com.
If you would like to be a guest blogger on the Minitab Blog, contact publicrelations@minitab.com.