


by Lion "Ari" Ondiappan Arivazhagan, guest blogger
In India, we've seen this story far too many times in recent years:Timmanna Hatti, a six-year old boy, was trapped in a 160-feet borewell for more than 5 days in Sulikeri village of Bagalkot district in Karnataka after falling into the well. Perhaps the most heartbreaking aspect of the situation was the decision of the Bagalkot district administration to stop the rescue operation because the digging work, if continued further, might lead to collapse of the vertical wall created by the side of the borewell within which Timmanna had struggled for his life.
Timmanna's body was retrieved from the well 8 days after he fell in. Sadly, this is just one of an alarming number of borewell accidents, especially involving little children, across India in the recent past.
This most recent event prompted me to conduct a preliminary study of borewell accidents across India in the last 8-9 years.
Using Data to Assess Borewell Accidents
My main objective was to find out the possible causes of such accidents and to assess the likelihood of such adverse events based on the data available to date.
This very preliminary study has heightened my awareness of lot of uncomfortable and dismaying factors involved in these deadly incidents, including the pathetic circumstances of many rural children and carelessness on the part of many borewell contractors and farmers.
In this post, I'll lead you through my analysis, which concludes with the use of a G-chart for the possible prediction of the next such adverse event, based on Geometric distribution probabilities.
Collecting Data on Borewell Accidents
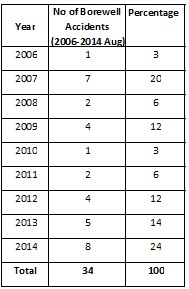
My search of newspaper articles and Google provided details about a total of 34 borewell incidents since 2006. The actual number of incidents may be higher, since many incidents go unreported. The table below shows the total number of borewell cases reported each year between 2006 and 2014.
Summary Analysis of the Borewell Accident Data
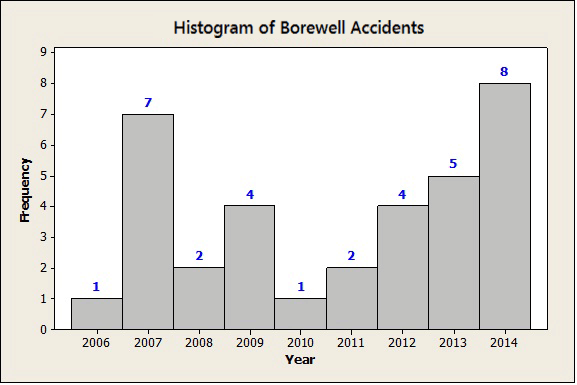
First, I used Minitab to create a histogram of the data I'd collected, shown below.
A quick review of the histogram reveals that out of 34 reported cases, the highest number of accidents occurred in the years 2007 and 2014.
The ages of children trapped in the borewells ranged from 2 years to 9 years. More boys (21) than girls (13) were involved in these incidents.
What hurts most is that, in this modern India, more than 70% of the children did not survive the incident. They died either in the borewell itself or in the hospital after the rescue. Only about 20% of children (7 out of 34) have been rescued successfully. The ultimate status of 10% of the cases reported is not known.
Pie Chart of Borewell Incidents by Indian State
Analysis of a state-wise pie chart, shown below, indicates that Haryana, Gujarat, and Tamil Nadu top the list of the borewell accident states. These three states alone account for more than 50% of the borewell accidents since 2006.

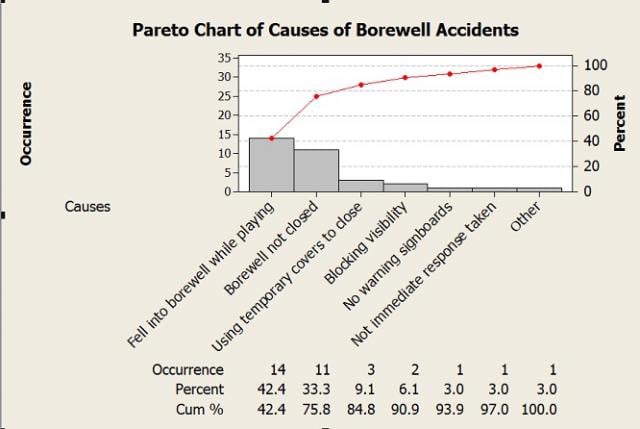
Pareto Chart for Vital Causes of Borewell Accidents
I used a Pareto chart to analyze the various causes of these borewell accidents, which revealed the top causes of these tragedies:
- Children accidentally falling into open borewell pits while playing in the fields.
- Abandoned borewell pits not bring properly closed / sealed.
Applying the Geometric Distribution to Rare Adverse Events
There are many different types of control charts, but for rare events, we can use Minitab Statistical Software and the G chart. Based on the geometric distribution, the G chart is designed specifically for monitoring rare events. In the geometric distribution, we count the number of opportunities before or until the defect (adverse event) occurs.
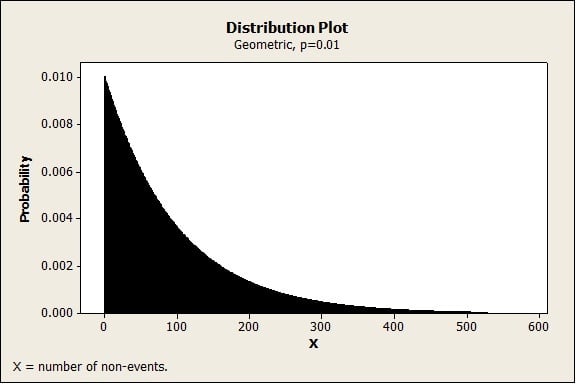
The figure below shows the geometric probability distribution of days between such rare events if the probability of the event is 0.01. As you can see, the odds of an event happening 50 or 100 days after the previous one are much higher than the odds of the next event happening 300 or 400 days later.
By using the geometric distribution to plot the number of days between rare events, such as borewell accidents, the G chart can reveal patterns or trends that might enable us to prevent such accidents in future. In this case, we count the number of days between reported borewell accidents. One key assumption, when counting the number of days between the events, is that the number of accidents per day was fairly constant.
A G-Chart for Prediction of the Next Borewell Accident
I now used Minitab to create a G-chart for the analysis of the borewell accident data I collected, shown below.
Although the observations fall within the upper and lower control limits (UCL and LCL), the G chart shows a cluster of observations below the center line (the mean) after the 28th observation and before the 34th observation (the latest event). Overall, the chart indicates/detects an unusually high rate adverse events (borewell accidents) over the past decade.
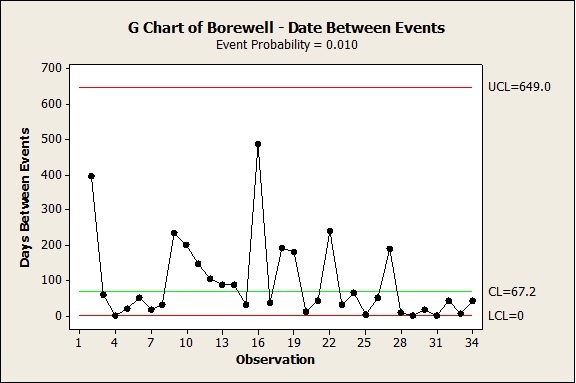
Descriptive statistics based on the Gaussian distribution for my data show 90.8 days as the mean "days between events." But the G-chart, based on geometric distribution, which is more apt for studying the distribution of adverse events, indicates a Mean (CL) of only 67.2 days as "days between events."
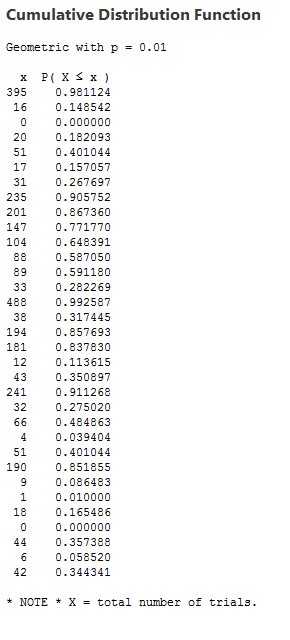
Predicting Days Between Borewell Accidents with a Cumulative Probability Distribution
I used Minitab to create a cumulative distribution function for data, using the geometric distribution with probability set at 0.01. This gives us some additional detail about how many incident-free days we're likely to have until the next borewell tragedy strikes:
Based on the above, we can reasonably predict when next borewell accident is most likely to occur in any of the states included in the data, especially in the states of Haryana, Tamil Nadu, Gujarat, Rajasthan, and Karnataka.
The probabilities are shown below, with the assumption that the sample size and the Gage R&R / Measurement errors of event data reported and collected are adequate and within the allowable limits.
Probability of next borewell event happening in...
- 31 days or less: 0.275020 = 27.5% appx.
- 104 days or less = 0.651907 = 65% appx.
- 181 days or less = 0.839452 = 84% appx.
- 488 days or less = 0.992661 = 99% appx.
My purpose in preparing this study would be fulfilled if enough people take preventive actions before the possibility of occurrence next such an adverse event within next 6 months (p > 80%). NGOs, government officials, and individuals all need to take preventive actions—like sealing all open borewells across India, especially in the above 5 states—to prevent many more innocent children from dying while playing.
About the Guest Blogger:
Ondiappan "Ari" Arivazhagan is an honors graduate in civil / structural engineering from the University of Madras. He is a certified PMP, PMI-SP, PMI-RMP from the Project Management Institute. He is also a Master Black Belt in Lean Six Sigma and has done Business Analytics from IIM, Bangalore. He has 30 years of professional global project management experience in various countries and has almost 14 years of teaching / training experience in project management and Lean Six Sigma. He is the Founder-CEO of International Institute of Project Management (IIPM), Chennai, and can be reached at askari@iipmchennai.com.
An earlier version of this article was published on LinkedIn.