Most people are familiar with the concept of statistics based on exposure to every-day information, such as people polls, election results, weather or sports stats, commercial product comparisons, etc. Someone collects a set of data, does some number-crunching, and produces for us some interesting statistics. These sorts of sample statistics are called ‘descriptive statistics’. Descriptive statistics summarize some aspect of the sample data on hand. For example, RBI’s, average monthly high/low temperature, the percent of adults who vote, etc.
But, often of greater interest--even if only implied--is what the sample tells us about the population of values from which it came, or about the population of values that will be generated in the future. When we use sample information to estimate population statistics--called ‘parameters’--we enter the world of ‘inferential statistics’. Think about ‘descriptive statistics’ as the ‘arithmetic’ of the world of statistics, and ‘inferential statistics’, as the ‘science’ of statistics.
All too often, statistics in the media and on-the-job are presented only as descriptive statistics. And then we pretend (or hope or think) that they are adequate to infer what’s going on in the population. Unfortunately, in most cases these inferences are at least a little bit wrong; and in some cases they are very wrong.
And I am not talking about the case of manipulating the numbers to present biased information, where the world of statistics gets the bad rap—you’ve heard all the lines about lying with statistics. We’re talking about legitimate random samples and statistical calculations that produce sample values.
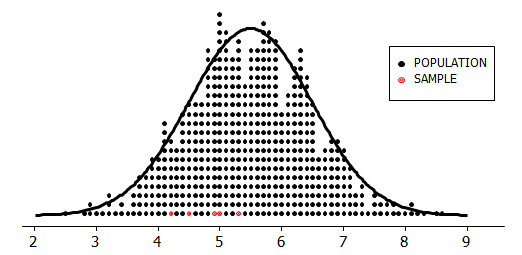
Consider the case of some random data, generated by Minitab, as depicted in the graphic below:

The black dots represent the population values. The red dots are 5 randomly selected sample values from this population.
It is clear from the picture that the sample does not provide an ‘exact’ depiction of population information.
A common statistic of interest is the average (aka, the mean). Since statisticians expect the sample average to be something different from the population average, we give them different names:
![]()
The sample average is called, “x-bar”. The population average, “μ”, is pronounced like a kitten sounds: “mew”.
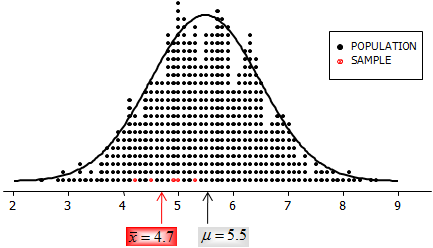
The population and sample averages are shown below:

As I’m sure you expected, the x-bar is less than μ. And there are other considerations:
- A different sample would provide a different x-bar—maybe closer, maybe not.
- If you increase the sample size, x-bar is likely to be closer to μ, but is unlikely to be exactly μ.
- How many sample values are needed to be close enough? Bear in mind that 'close enough' when testing shaving cream probably isn’t close enough when testing drugs.
The moral of the story:
Every descriptive statistic you read, hear, or calculate--if intended to convey information about the population--is highly likely to be at least a little bit wrong.
In the next post we’ll talk about a simple statistical tool that provides a reliable indication of what the population parameter might actually be, given the information available in the sample.


