


The Olympic games are about to begin in Rio de Janeiro. Over the next 16 days, more than 11,000 athletes from 206 countries will be competing in 306 different events. That's the most events ever in any Olympic games. It's almost twice as many events as there were 50 years ago, and exactly three times as many as there were 100 years ago.
Since the number of Olympic events has changed over time, this makes it a great data set for a time series analysis.
A time series is a sequence of observations over regularly spaced intervals of time. The first step when analyzing time series data is to create a time series plot to look for trends and seasonality. A trend is a long-term tendency of a series to increase or decrease. Seasonality is the periodic fluctuation in the time series within a certain period—for example, sales for a store might increase every year in November and December. Here is a time series plot of the number of Olympic events since 1896.
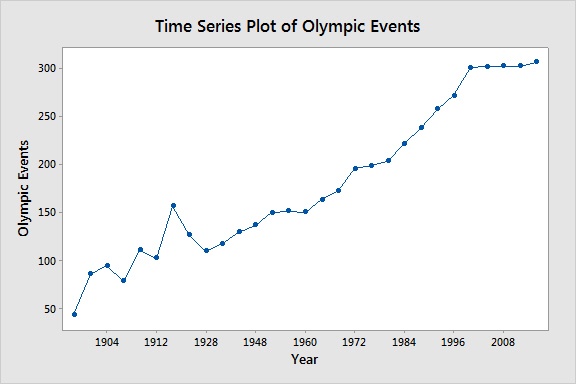
There is clearly an upward trend, but no seasonal pattern. The data is also a little choppy at the beginning. Part of the explanation is that the data points are not evenly spaced. Most Olympic games are 4 years apart, but a few of them are just 2 years apart, and during World War I and World War II there were 8-year and 12-year gaps, respectively. Since time series data should be evenly spaced over time, we'll only look at data from 1948 on, when the Olympics started being held every 4 years without any interruptions.
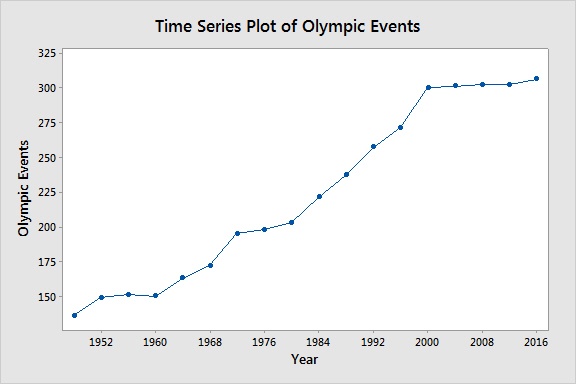
Now that we have an evenly spaced series that clearly exhibits a trend, we can use a trend analysis in Minitab Statistical Software to model the data. With a trend analysis, you can use four different types of models: linear, quadratic, exponential growth, and s-curve. We'll analyze our data using both the linear and s-curve models. An additional time series analysis you can use when your data exhibit a trend is double exponential smoothing, so we'll use that method too.
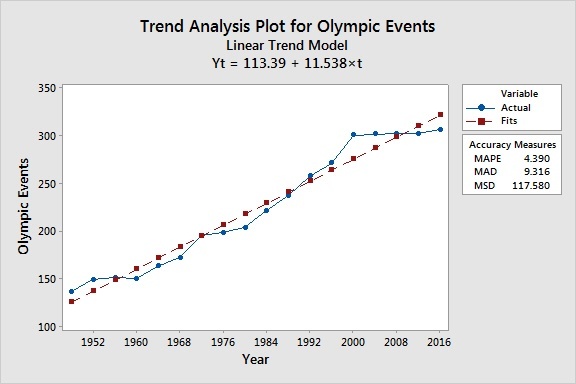
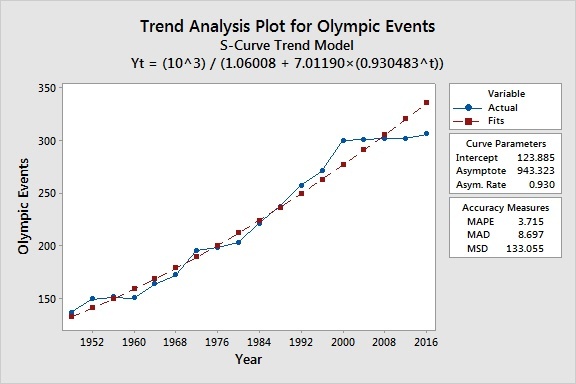
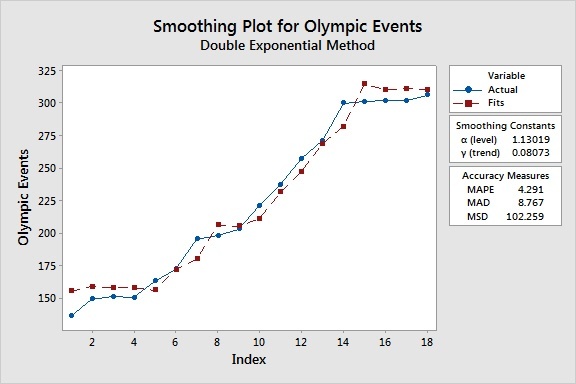
You can use the accuracy measures (MAPE, MAD, MSD) to compare the fits of different time series models. For all three of these statistics, smaller values usually indicate a better-fitting model. If a single model does not have the lowest values for all three statistics, MAPE is usually the preferred measurement.
For the time series of olympic event data, the s-curve model has the lowest values of MAPE and MAD, while the double exponential smoothing method has the lowest value for MSD. Based on the "MAPE breaks all ties" guideline, it appears that the s-curve model is the one we want to use.
However, accuracy measures shouldn't be the sole criteria you use to select a model. It's also important to examine the fit of the model, especially at the end of the series. And if the last 5 Olympics are any indication, it appears that the trend of adding large quantities of events to the Olympic Games is coming to an end. In the last 16 years, only 6 events have been added.
The double exponential smoothing model appears to have adjusted for this change, whereas the two trend analysis models have not. Given this additional consideration, the double exponential smoothing model is the one we should pick, especially if we want to use it to forecast future observations.
And now that we've settled on a model, we can sit back, relax, and watch all 918 medals be won. Let the games begin!