


The college football season is here, and this raises a very important question:
Is Alabama going to be undefeated when they win the national championship, or will they lose a regular-season game along the way?
Okay, so it's not a given that Alabama is going to win the championship this year, but when you've won 4 of the last 7 you're definitely the odds-on favorite.
However, what if we wanted to take a quantitative look at Alabama's chances of going undefeated instead of just giving hot takes like the one above? How could we determine a probability of Alabama winning a specific number of games this year?
The answer is easy: a Monte Carlo Simulation.
Monte Carlo simulations use repeated random sampling to simulate data for a given mathematical model and evaluate the outcome. Sounds like the perfect situation for Minitab Statistical Software. We're going to use a Monte Carlo simulation to have Alabama play their schedule 100,000 times! But we need to establish a few things before we get started.
The Transfer Equation
First, we need a model to use in our simulation. This can be a known formula from your specific area of expertise, or it could be a model created from a designed experiment (DOE) or regression analysis. In our situation, we already know the transfer equation. It's just the summation of the number of games that Alabama wins during the season:
Game1 + Game2 + Game3 ... + Game12
The Variables
Next, we need to define the distribution and parameters for the variables in our equation. We have 12 variables, one for each game Alabama will play.
For each game, Alabama can either win or lose. So each variable comes from the binomial distribution because there are only two outcomes.
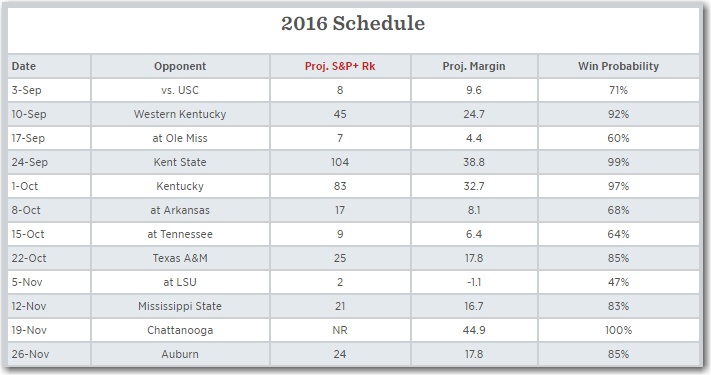
Now we just need to determine the probability Alabama has of winning each game. For that, I'll turn to Bill Connelly's S&P+ rankings. These rankings use play-by-play and drive data from every game to rank college football teams. But most importantly, these rankings can be used to generate win probabilities for individual games. And that's where the probability for our 12 binomial variables will come from.
Generate the Random Data
Now that we have our variables, it's time to generate the random data for each one. We'll start with Alabama's opening game against USC, which is a binomial random variable with a probability of 0.71. To generate this data in Minitab, go to Calc > Random Data > Binomial. Then complete the dialog as follows.
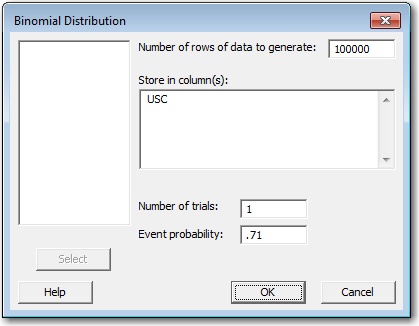
We're going to simulate this game 100,000 times, so that is the number of rows of data we want to generate. We want each row to represent a single game, so the number of trials is 1. And lastly, Alabama has a 71% chance of winning, so the event probability is 0.71.
After we repeat this for the other 11 games, we'll have simulated Alabama's regular season 100,000 times! Now all that's left to do is to analyze the results!
Note: The probability for Alabama beating Chattanooga is 100%, but the probability for the binomial distribution has to be less than 1. So I used a value of 0.9999. Out of 100,000 games Chattanooga actually won twice! Hey, it's sports, anything can happen!
Analyze the Simulation
Remember that transfer equation we came up with at the beginning? Now that we have the data for all of our variables, it's time to use it! Go to Calc > Calculator, and set up the equation to store the results in a new column.
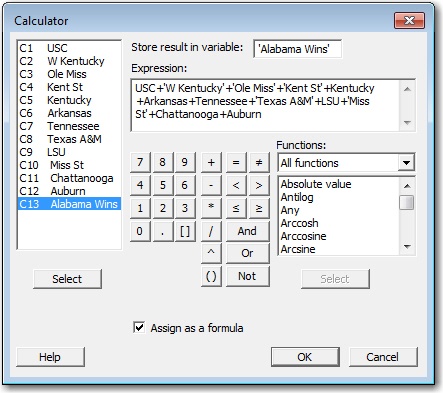
I created a new column called "Alabama Wins" and entered the sum of the individual game columns in the expression. This will give me the number of wins Alabama will have for 100,000 different seasons! We can use a histogram to view the results.
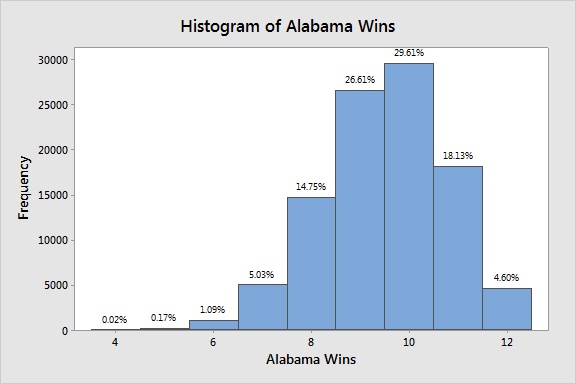
The most common outcome was a 10-win season, which Alabama did approximately 29.6% of the time. And the simulation suggests it doesn't look good for Alabama going undefeated. That only happens in 4.6% of the simulations. In fact, there is a better chance that Alabama wins 7 games than all 12! A 7-5 Alabama team sounds impossible. But this is sports, and as our simulation has just shown, anything can happen!
Monte Carlo simulations can be applied to a wide variety of areas outside of sports too. If you want more, check out this article that illustrates how to use Minitab for Monte Carlo simulations using both a known engineering formula and a DOE equation.