


One common question Minitab trainers receive is, "What should I do when my data isn’t normal?" A large number of statistical tests are based on the assumption of normality, so not having data that is normally distributed typically instills a lot of fear.
Many practitioners suggest that if your data are not normal, you should do a nonparametric version of the test, which does not assume normality. From my experience, I would say that if you have non-normal data, you may look at the nonparametric version of the test you are interested in running. But more important, if the test you are running is not sensitive to normality, you may still run it even if the data are not normal.
What tests are robust to the assumption of normality?
Several tests are "robust" to the assumption of normality, including t-tests (1-sample, 2-sample, and paired t-tests), Analysis of Variance (ANOVA), Regression, and Design of Experiments (DOE). The trick I use to remember which tests are robust to normality is to recognize that tests which make inferences about means, or about the expected average response at certain factor levels, are generally robust to normality. That is why even though normality is an underlying assumption for the tests above, they should work for nonnormal data almost as well as if the data (or residuals) were normal.
The following example that illustrates this point. (You can download the data set here and follow along if you would like. If you don't have Minitab, download the free 30-day trial version, too.)
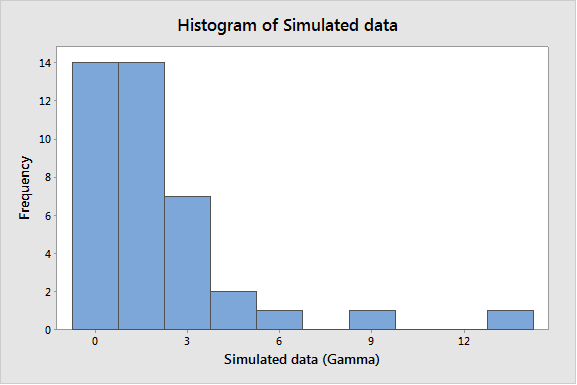
Generating random data from a Gamma distribution with a scale of 1 and a shape of 2 will produce data that is bounded at 0, and highly skewed. The theoretical mean of this data is 2. It should be clear that the data is not normal—not even approximately normal!
What if I want to test the hypothesis that the population mean is 2? Would I be able to do it effectively with a 1-sample t-test? If normality is not strictly required, I should be able to run the test and have the correct conclusion about 95% of the time—or, in more technical terms, with roughly 95% confidence, right?
To test this, I am providing a little bit of code that will generate 40 samples from a Gamma (1, 2) and will store the p-value for a 1-sample t-test in column C9 of an empty worksheet. To reproduce similar results on your own, copy the following commands and paste them into Notepad. (Alternatively, you can download this file.) Save the file with the name “p-values.mtb”, and make sure to use the double quotes as part of the file name to ensure that the extension becomes MTB and not the default TXT.
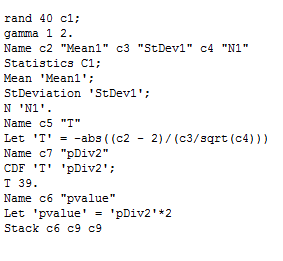
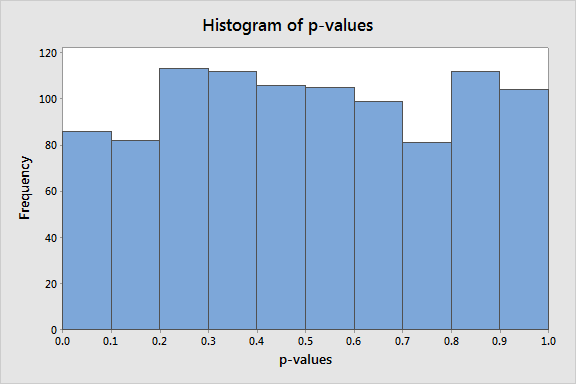
Once the file is saved, choose Tools > Run an Exec. In Number of times to execute the file, enter a relatively large number, such as 1000, and hit Select File, browse to the location on your computer where the p-values.MTB file is saved, and select the executable you just created. Click Open. Grab a cup of coffee, and once you get back to your desk, the simulation should be about done. Once the simulation is complete, create a histogram of column C9 (p-values) by choosing Graph > Histogram. This shows that the p-values are uniformly distributed between 0 and 1, just like they should when the null hypothesis is true.
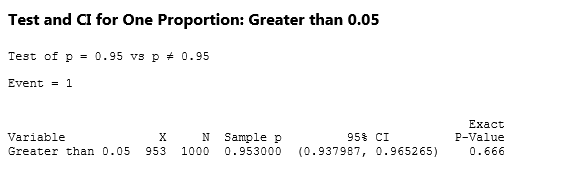
What percentage of the time in the simulation above did we fail to reject the null? In the simulation I ran, this happened in 95.3% of the instances. Amazing, huh? What does this really mean, though? In layman’s terms, the test is working with approximately 95% confidence, despite the fact that the data is clearly not normal!
For more on simulated p-values for a 1-sample t-test, be sure check out this recent post on “p-value roulette.”
Note that if you’re following along and running your own simulation, the histogram and output above will most likely not match yours precisely. This is the beauty of simulated data—it’s going to be a little different each time. However, even with slightly different numbers, the conclusion you reach from the analysis should be about the same.
At this point, I hope you feel a little more comfortable about using these tests that are robust to normality, even if your data don't meet the normality assumption. The Assistant menu can also help you, as some of these “rules of thumb” are built into the Report Card, which informs you that this particular test would be accurate even with nonnormal data.
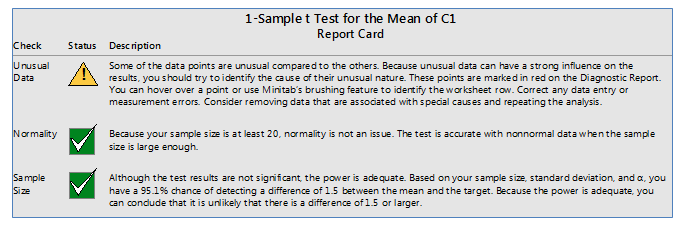
It is also worth mentioning that the unusual data check in the Assistant even offers a warning about some unusual observations. These unusual observations could have been outliers if the data were normally distributed. In this case though, since we know this data was generated at random, we can be confident that they are not outliers, but proper observations the reflect an underlying nonnormal distribution.
Whenever a normality test fails, an important skill to develop is to determine the reason for why the data is not normal. A few common reasons include:
- The underlying distribution is nonnormal.
- Outliers or mixed distributions are present.
- A low discrimination gauge is used.
- Skewness is present in the data.
- you have a large sample size.
What tests are not robust to the normality assumption?
If tests around means are—in general—robust to the normality assumption, then when is normality a critical assumption? In general, tests that try to make inferences about the tails of the distribution will require the distribution assumption to be met.
Some examples include:
1. Capability Analysis and determining Cpk and Ppk
2. Tolerance Intervals
3. Acceptance Sampling for variable data
4. Reliability Analysis to estimate low or high percentiles
The tests for equal variances also are known to be extremely sensitive to the normality assumption.
If you would like to learn how to assess normality by understanding the sensitivity of normality tests under different scenarios, or to analyze nonnormal data when the assumption is extremely critical, or not so critical, you should check out our new course on Analysis of Nonnormal Data for Quality.