


People who are ill frequently need medication. But if they miss a dose, or receive the wrong medication—or even get the wrong dose of the right medication—the results can be disastrous.
So medical professionals have a lot at stake in making sure patients get the right medicine, in the right amount, at the right time. But hospitals and other medical facilities are complex systems, and mistakes do occur.The application of data analysis and statistics can help detect where errors are occurring so that effective improvements can be made, whether it's on the factory floor or the ICU.
Is Every Patient Getting the Right Medication?
Suppose you work for a small hospital, whose staff administers medications to hundreds of patients every week. You want to make sure every patient gets the right amount of the right medication at the right time, but over the past 32 weeks, your hospital has seen 156 medication errors—obviously far too many.
To make sense of your data, you turn to the Assistant in Minitab Statistical Software. (If you're not already using our software and you want to play along, please download the free 30-day trial.)
Your data includes counts of the number of patients treated each week, and the number of medication errors that occur.
Identify the Important Factors
To get better insight into the situation, you gather more comprehensive data on a random sample of 100 medication errors, including the type of error and the time it occurred.
Since it’s always a good idea to visualize your data, you select Assistant > Graphical Analysis.
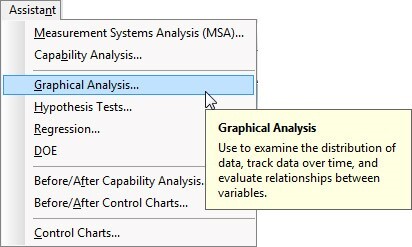
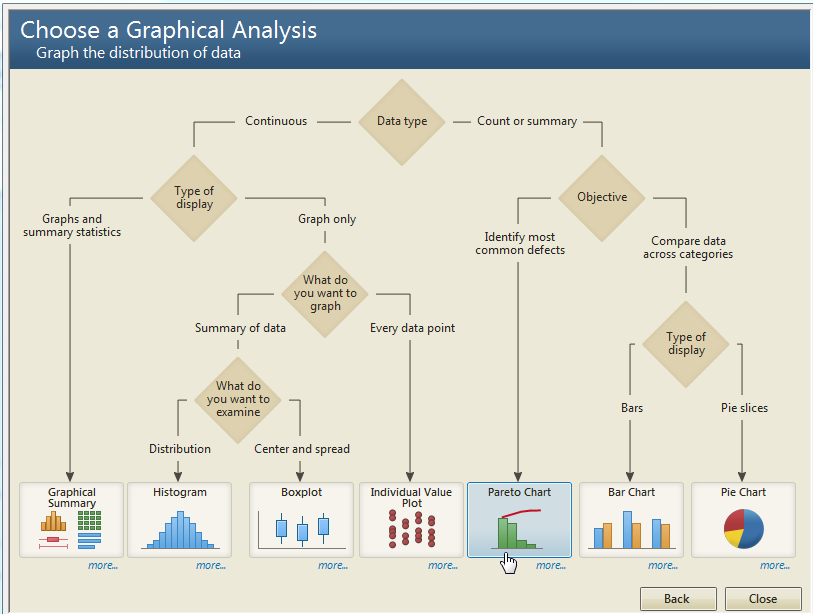
You want to know what types of medication errors are the most frequent. The Assistant's decision tree will guide you to the right option. Since you want to see the defect types for the count data you’ve collected, the Assistant directs you to the Pareto Chart.
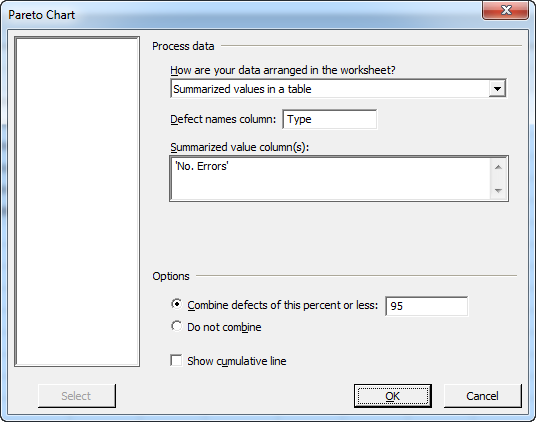
Click the button and fill out the dialog box as follows:
The resulting chart shows that in nearly 75 percent of the incidents, patients either received too little medication or got their medication at the wrong time.
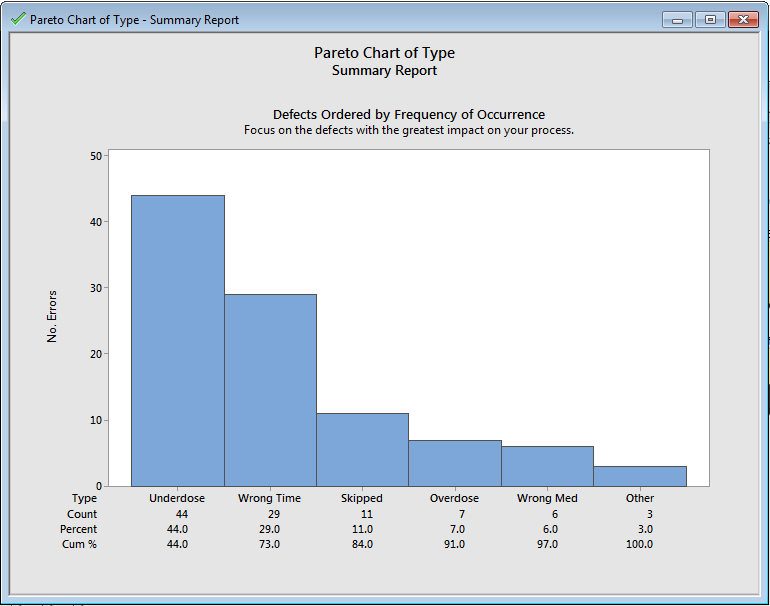
Based on this knowledge, you and your team devise and implement process changes designed to help hospital staff give patients the proper dosage of medications and adhere strictly to the treatment times specified by their physicians.
Create a Before / After Control Chart
After the changes have been implemented, you gather additional data over several weeks to see whether errors have been reduced. Your data set includes counts of the number of patients treated each week, and the number of medication errors that occurred. Now your administrator wants to know what effect the changes had.
You select Assistant > Before/After Control Charts… to create a chart to easily see if the changes made the desired impact.
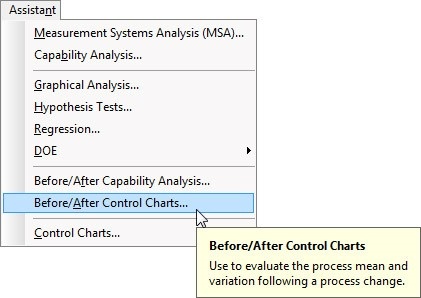
Because you have attribute data, and since each patient could be associated with more than one medication error, the Assistant's decision tree guides you to the U Chart. Complete the dialog box as shown:
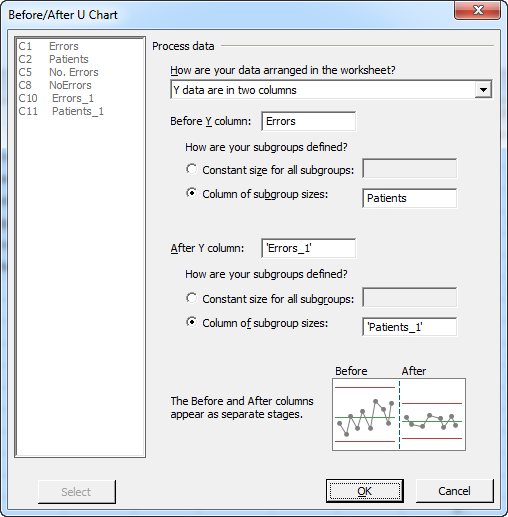
This yields the following chart:
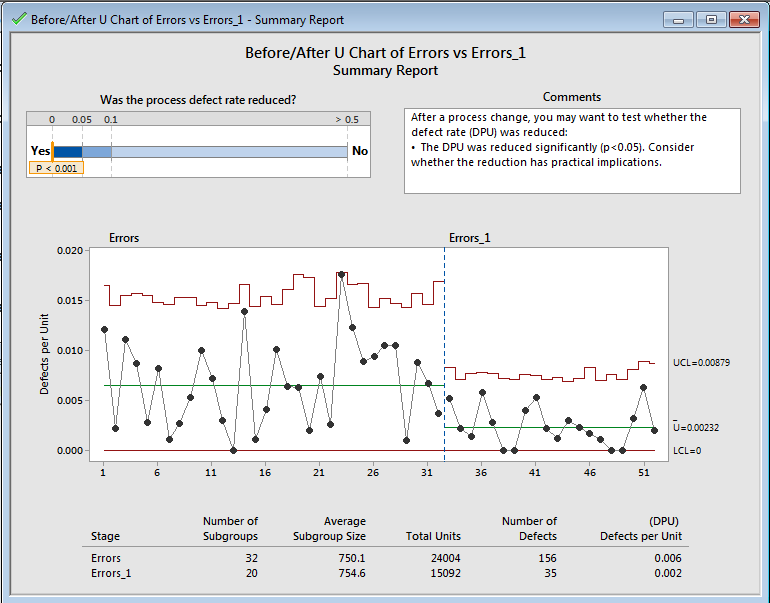
Your before/after control chart shows that the changes have had a significant impact on the amount of medication errors. The chart also shows that the new process is stable and in statistical control.
Just What the Doctor Ordered
Even if you’re not a statistician, you can benefit from using statistical tools to look at your data.
With the Assistant, it's very easy to create a Pareto Chart to identify and focus your efforts on the most frequent medication errors. After you've implemented changes, the Assistant’s Before/After Control Charts make it easy to demonstrate that your improvements have significantly reduced the number of medication errors.
What improvements can you make next?