


You need to consider many factors when you’re buying a used car. Once you narrow your choice down to a particular car model, you can get a wealth of information about individual cars on the market through the Internet. How do you navigate through it all to find the best deal? By analyzing the data you have available.
Let's look at how this works using the Assistant in Minitab Statistical Software. With the Assistant, you can use regression analysis to calculate the expected price of a vehicle based on variables such as year, mileage, whether or not the technology package is included, and whether or not a free Carfax report is included.
And it's probably a lot easier than you think.
A search of a leading Internet auto sales site yielded data about 988 vehicles of a specific make and model. After putting the data into Minitab, we choose Assistant > Regression…
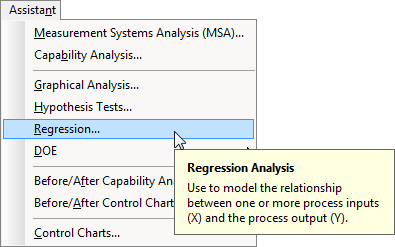
At this point, if you aren’t very comfortable with regression, the Assistant makes it easy to select the right option for your analysis.
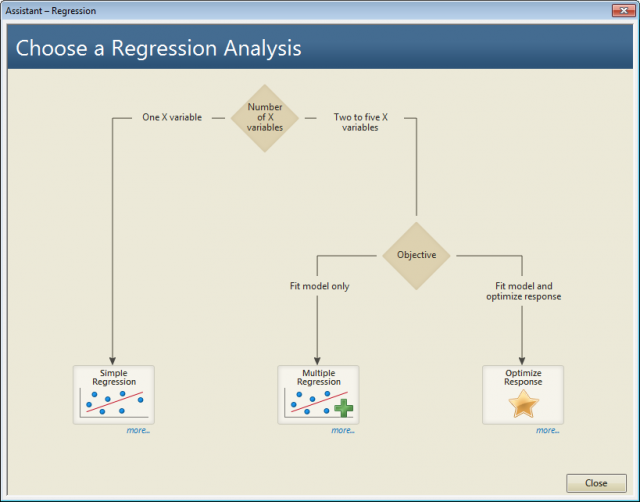
A Decision Tree for Selecting the Right Analysis
We want to explore the relationships between the price of the vehicle and four factors, or X variables. Since we have more than one X variable, and since we're not looking to optimize a response, we want to choose Multiple Regression.
This data set includes five columns: mileage, the age of the car in years, whether or not it has a technology package, whether or not it includes a free CARFAX report, and, finally, the price of the car. We don’t know which of these factors may have significant relationship to the cost of the vehicle, but we don’t need to. Just fill out the dialog box as shown.
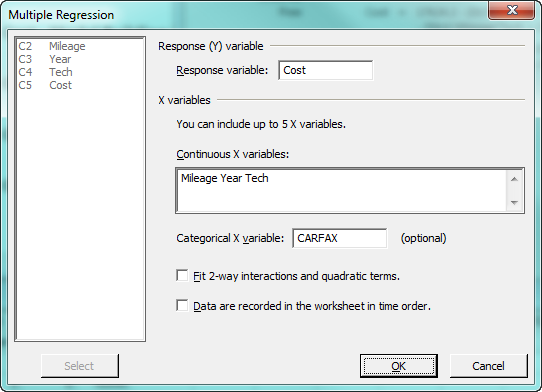
Press OK and the Assistant assesses each potential model and selects the best-fitting one. It also provides a comprehensive set of reports, including a Model Building Report that details how the final model was selected and a Report Card that notifies you to potential problems with the analysis, if there are any.
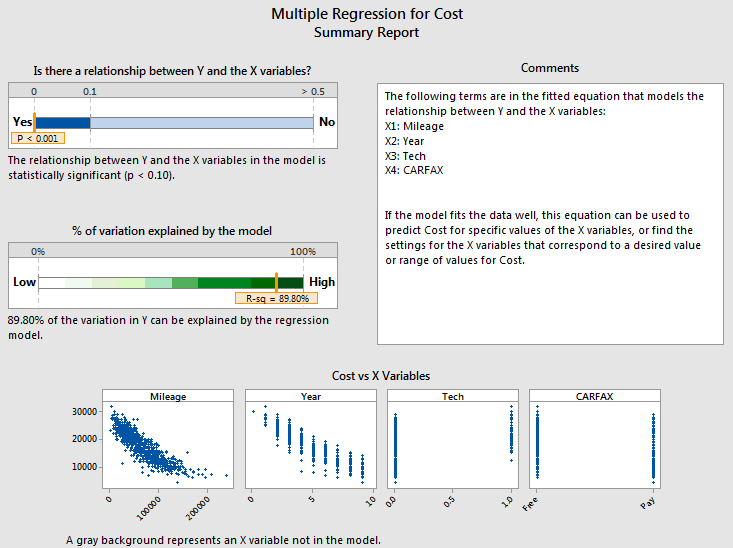
Interpreting Regression Results in Plain Language
The Summary Report tells us in plain language that there is a significant relationship between the Y and X variables in this analysis, and that the factors in the final model explain 89.8 percent of the observed variation in price. It confirms that all of the variables we looked at are significant.
The Model Equations Report contains the final regression models, which can be used to predict the price of a used vehicle. The Assistant provides 2 equations, one for vehicles that include a free CARFAX report, and one for vehicles that do not.

We can see several interesting things about the price of this vehicle model by reading the equations. First, the constant for cars with a free CARFAX report is 27,799, while the constant for a paid report is 27,358. This tells us that all other things being equal, the average cost for vehicles with a free report is raised on average about $441 above vehicles with a paid report. This could be because these cars probably have a clean report (if not, the sellers probably wouldn’t provide it for free).
Second, each additional mile added to the car decreases its expected price by roughly 6 cents, while each year added to the car's age decreases the expected price by $1,310. The technology package adds, on average, $1,044 to the price of vehicles.
Residuals versus Fitted Values
While these findings are interesting, our goal is to find the car that offers the best value. In other words, we want to find the car that has the largest difference between the asking price and the expected asking price predicted by the regression analysis.
For that, we can look at the Assistant’s Diagnostic Report. The report presents a chart of Residuals vs. Fitted Values. If we see obvious patterns in this chart, it can indicate problems with the analysis. In that respect, this chart of Residuals vs. Fitted Values looks fine, but now we’re going to use the chart to identify the best value on the market.
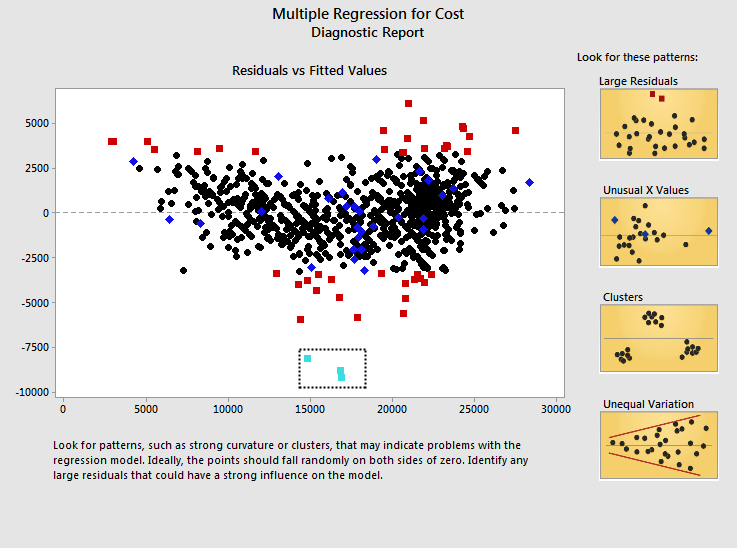
In this analysis, the “Fitted Values” are the prices predicted by the regression model. “Residuals” are what you get when you subtract the actual asking price from the predicted asking price—exactly the information you’re looking for! The Assistant marks large residuals in red, making them very easy to find. And three of those residuals—which appear in light blue above because we’ve selected them—appear to be very far below the asking price predicted by the regression analysis.
Selecting these data points on the graph reveals that these are vehicles whose data appears in rows 357, 359, and 934 of the data sheet. Now we can revisit those vehicles online to see if one of them is the right vehicle to purchase, or if there’s something undesirable that explains the low asking price.
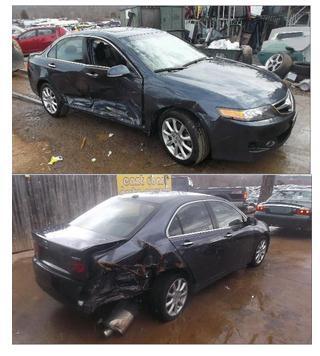
Sure enough, the records for those vehicles reveal that two of them have severe collision damage.
But the remaining vehicle appears to be in pristine condition, and is several thousand dollars less than the price you’d expect to pay, based on this analysis!
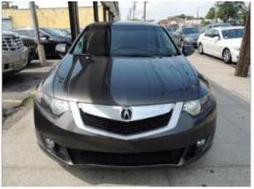
With the power of regression analysis and the Assistant, we’ve found a great used car—at a price you know is a real bargain.