Recently I've been refreshing my knowledge of reliability analysis, which is the use of data to assess a product's ability to perform over time. Quality engineers typically use reliability analysis to predict the likelihood that a certain percentage of products will fail over a given amount of time.
Why does choice of distribution matter for reliability analysis?
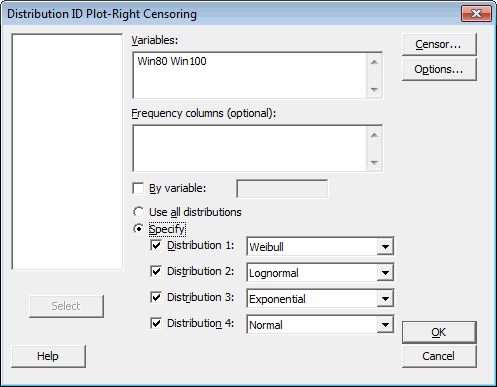
Using statistical software to identify the distribution of reliability data
- Do the data follow a symmetric distribution? Are they skewed left or right?
- Is the failure rate rising or falling? Or is it staying constant?
- What distribution has worked for this analysis in the past?


Choosing the best distribution model from the identification plot
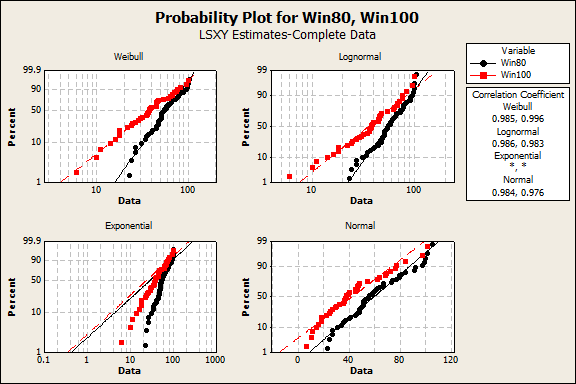
We're looking to see which distribution line is the best match for our data. Immediately we can rule out the Exponential distribution, where barely any of our data points follow the best-fit line. The other three look better, but the points seem to fit the straight line of the lognormal plot best, so that distribution would be a good choice for running subsequent reliability analyses.
It can sometimes be difficult to tell which distribution is the best fit from the graph, so you should also check the Anderson-Darling goodness-of-fit values and other statistics in the Session window output. The Anderson-Darling values appear alongside the "Correlation Coefficients" on the plot. The smaller the Anderson-Darling value, the better the fit of the distribution.
For our data, the Anderson-Darling value for the lognormal distribution is lower than those for other distributions, further supporting the lognormal distribution as the best fit.
Have you ever needed to identify the distribution of your data? How did you do it?
Case study:
Time-to-Market and Design for Reliability at the Speed of Light in Signify
Get ready for a light bulb moment! In a fast-changing industry where time-to-market and product reliability give a competitive edge, discover how the world’s leading lighting company Signify, rapidly validates new innovations. In this one hour webinar, Prof W.D. van Driel and Dr P. Watté will shed a light on design for reliability (DfR) using Minitab Statistical Software at Signify, the former Philips Lighting. Learn from real-life examples their methods to lower your development costs, improve your designs’ performance and compliance, and accelerate the testing of product design reliability. If you develop products intended to meet high specifications for years to come, you will discover how to reduce the risks and consequences of product failure and costly claims - for you and your customers.


![[Webinar Replay] Time-to-Market and Design for Reliability at the Speed of Light at Signify](https://no-cache.hubspot.com/cta/default/3447555/b70a5a3e-03b6-408b-bbc1-7851ef13e4e9.png)